Hi,
we are on the verge of migrating to 2.27.1 (from 2.23.6). We are aware that that’s a big task to do.
Since weeks we are stuck on a problem with GeoServer’s memory foot-print that we cannot really find the cause for and also only have a workaround solution. I am trying to explain the tests and observations here, seeing if someone else has made similar observations, or might be able to help find the cause - an maybe even a proper solution.
Let me try to explain:
Load tests
As part of our standard procedure, we have been running load tests on 2.27.1. The way we do this is to take the “minimal” data set from GeoServer, then define a few data stores and layers - for this test we used GRIB2 numerical weather prediction data (gs-grib plugin).
Then we ran WMS requests on 4 layers with 16 tiles of 256x256 each (EPSG:4326 bbox). We run the requests without any dimension settings and default raster style.
The way we run the tests is that for the four layers the requests are executed in parallel without any delays.
That way we are basically bombarding GeoServer with many requests (~15.000 requests/min) . We are feeding the system metrics and tomcat metrics into elastic and are monitoring system load/cpu/memory and number of requests tomcat/GeoServer is able to handle.
Note, all of the upcoming depictions have been performed on the same server (~90GB RAM), the same tomcat and by using JDK 21.0.7 - especially also the tests of GeoServer 2.23.6 which does not show the described problem.
2.27.1: Problem with off-heap memory consumption and resulting server crashes
Shortly after our first tests we noticed that our GeoServers (now on 2.27.1) keep crashing with OOMs.
Our setup (copied from 2.23.6) is basically
- initial heap: 10BG
- max heap: 40BG
- garbage collector: G1GC
- ~90GB RAM
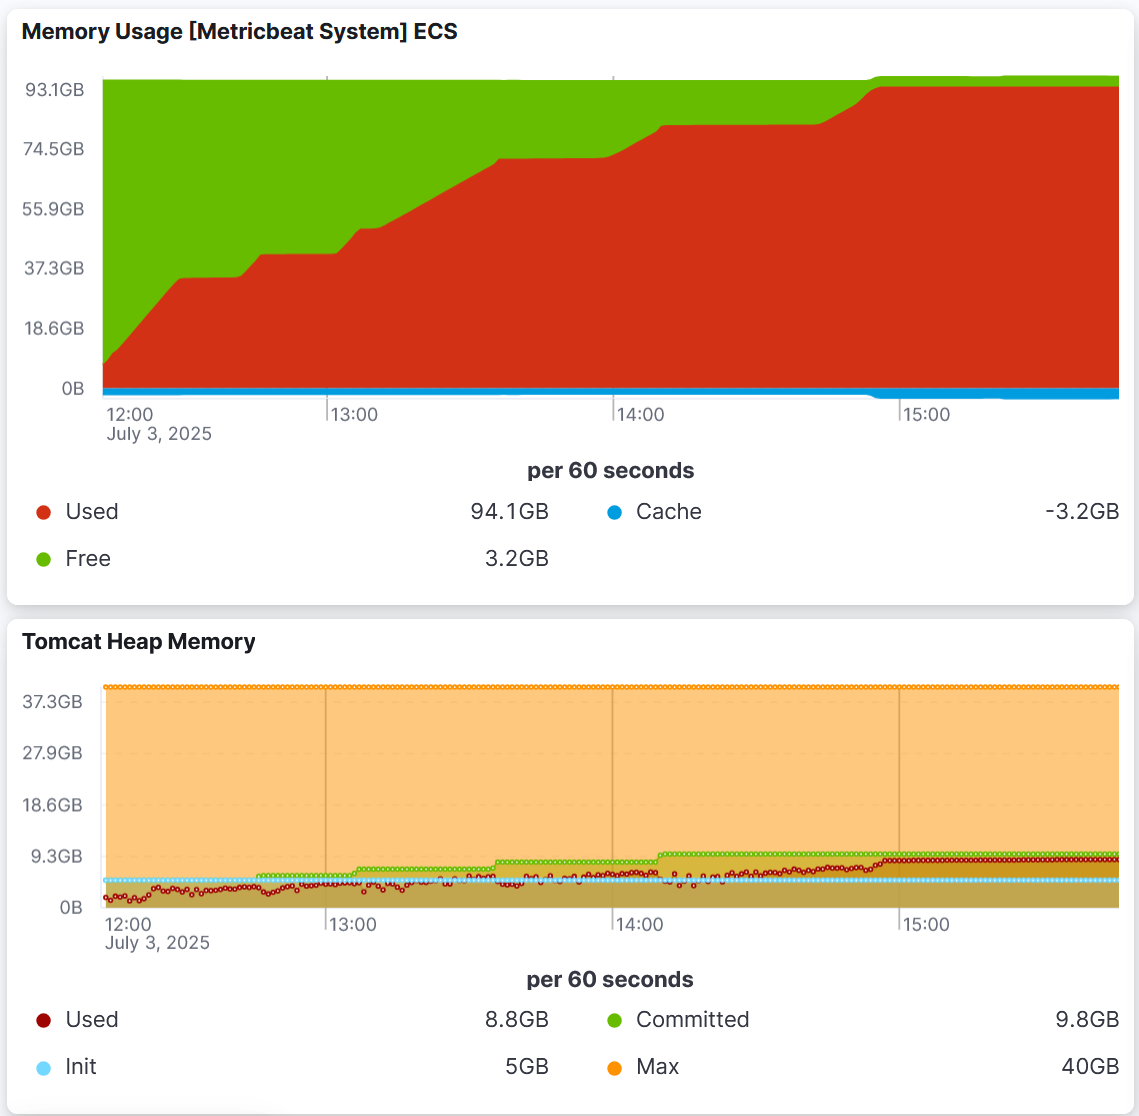
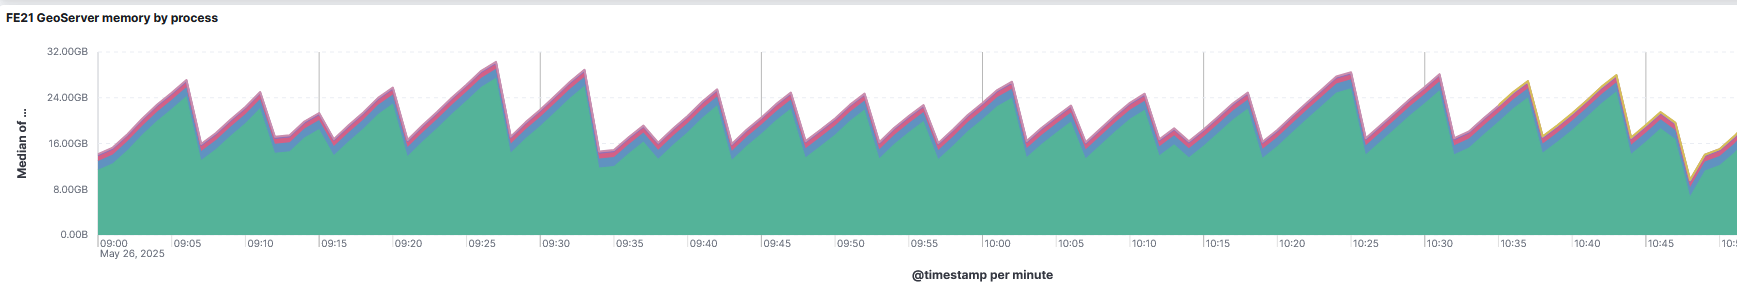
With the above mentioned loads tests, we have been observing the following memory consumption foot-print
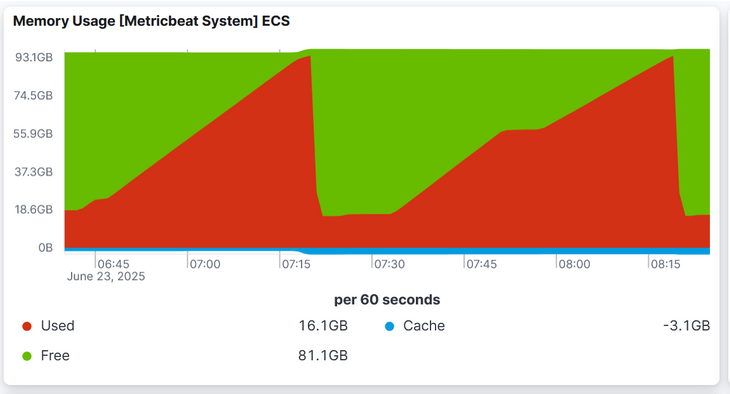
We can see that the memory consumption increased dramatically over a very short period of time. At the times where the memory suddenly dropped was when our server crashed and restarted itself.
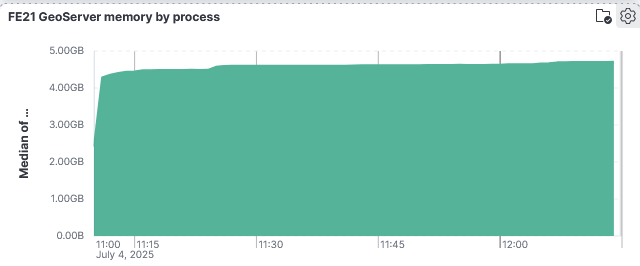
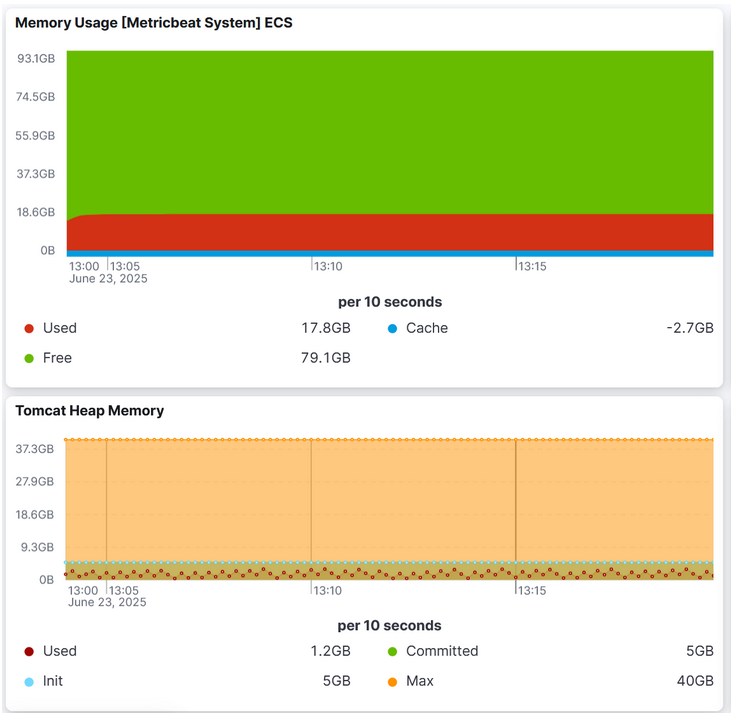
Looking further, we analyzed the heap:
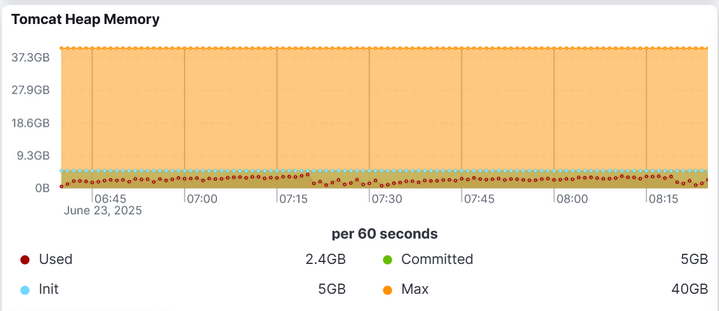
Interestingly, the heap did not increase at all. Taking heap dumps on the VM showed the same - nothing unusual.
Our conclusion is that somehow that vast memory consumption must be off-heap. Unfortunately, native memory tracking didn’t really reveal any problems:
Native Memory Tracking:

(Omitting categories weighting less than 1KB)

Total: reserved=44452560KB +66584KB, committed=5753500KB +143104KB

-                 Java Heap (reserved=41943040KB, committed=5242880KB)
                            (mmap: reserved=41943040KB, committed=5242880KB)

-                     Class (reserved=1051336KB +1035KB, committed=17928KB +4491KB)
                            (classes #22932 +4656)
                            (  instance classes #21591 +4360, array classes #1341 +296)
                            (malloc=2760KB +1035KB #88290 +31693)
                            (mmap: reserved=1048576KB, committed=15168KB +3456KB)
                           : (  Metadata)
                            (    reserved=131072KB, committed=117504KB +31808KB)
                            (    used=116896KB +31646KB)
                            (    waste=608KB =0,52% +162KB)
                           : (  Class space)
                            (    reserved=1048576KB, committed=15168KB +3456KB)
                            (    used=14539KB +3254KB)
                            (    waste=629KB =4,14% +202KB)

-                    Thread (reserved=85255KB +14243KB, committed=7515KB +1899KB)
                            (thread #83 +13)
                            (stack: reserved=84996KB +14200KB, committed=7256KB +1856KB)
                            (malloc=163KB +28KB #505 +78)
                            (arena=95KB +15d #164 +26)

-                      Code (reserved=257317KB +5674KB, committed=103421KB +59274KB)
                            (malloc=9633KB +5674KB #25090 +11830)
                            (mmap: reserved=247684KB, committed=93788KB +53600KB)

-                        GC (reserved=885678KB +3668KB, committed=168878KB +3668KB)
                            (malloc=33218KB +3668KB #23427 +14256)
                            (mmap: reserved=852460KB, committed=135660KB)

-                 GCCardSet (reserved=72KB +21KB, committed=72KB +21KB)
                            (malloc=72KB +21KB #609 +114)

-                  Compiler (reserved=632KB +273KB, committed=632KB +273KB)
                            (malloc=468KB +273KB #1942 +754)
                            (arena=164KB #4)

-                  Internal (reserved=35807KB +35260KB, committed=35807KB +35260KB)
                            (malloc=35771KB +35260KB #82757 +68971)
                            (mmap: reserved=36KB, committed=36KB)

-                     Other (reserved=356KB +208KB, committed=356KB +208KB)
                            (malloc=356KB +208KB #44 +20)

-                    Symbol (reserved=34622KB +7181KB, committed=34622KB +7181KB)
                            (malloc=29499KB +5998KB #345299 +66485)
                            (arena=5122KB +1183d #1)

-    Native Memory Tracking (reserved=9275KB +3172KB, committed=9275KB +3172KB)
                            (malloc=203KB +81KB #3649 +1466)
                            (tracking overhead=9073KB +3091KB)

-        Shared class space (reserved=16384KB, committed=12896KB)
                            (mmap: reserved=16384KB, committed=12896KB)

-               Arena Chunk (reserved=101KB -4811KB, committed=101KB -4811KB)
                            (malloc=101KB -4811KB)

-                   Tracing (reserved=32KB, committed=32KB)
                            (arena=32KB #1)

-                    Module (reserved=627KB +264KB, committed=627KB +264KB)
                            (malloc=627KB +264KB #5697 +932)

-                 Safepoint (reserved=8KB, committed=8KB)
                            (mmap: reserved=8KB, committed=8KB)

-           Synchronization (reserved=207KB +82KB, committed=207KB +82KB)
                            (malloc=207KB +82KB #2012 +814)

-            Serviceability (reserved=24KB +6KB, committed=24KB +6KB)
                            (malloc=24KB +6KB #159 +128)

-                 Metaspace (reserved=131757KB +324KB, committed=118189KB +32132KB)
                            (malloc=685KB +324KB #662 +445)
                            (mmap: reserved=131072KB, committed=117504KB +31808KB)

-      String Deduplication (reserved=1KB, committed=1KB)
                            (malloc=1KB #8)

-           Object Monitors (reserved=31KB -14KB, committed=31KB -14KB)
                            (malloc=31KB -14KB #151 -71)
The numbers aren’t rising as much as we have anticipated, only +143MB. Our only current explanation is that native memory might be allocated, no longer used, but somehow not freed.
Workaround solution: The role of ZGC and tile-recycling
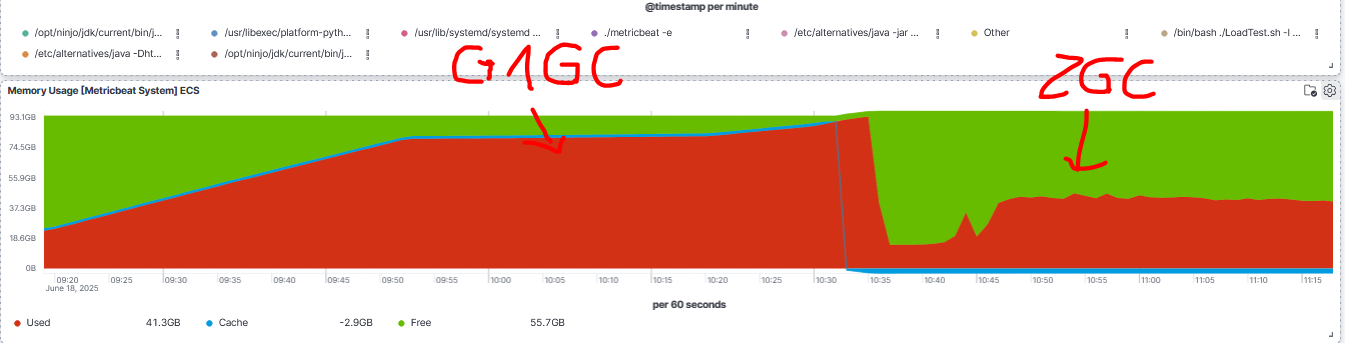
One thing that we observed is that more aggressive garbage collection seems to limit the increase of the off-heap memory consumption to the defined max-heap settings.
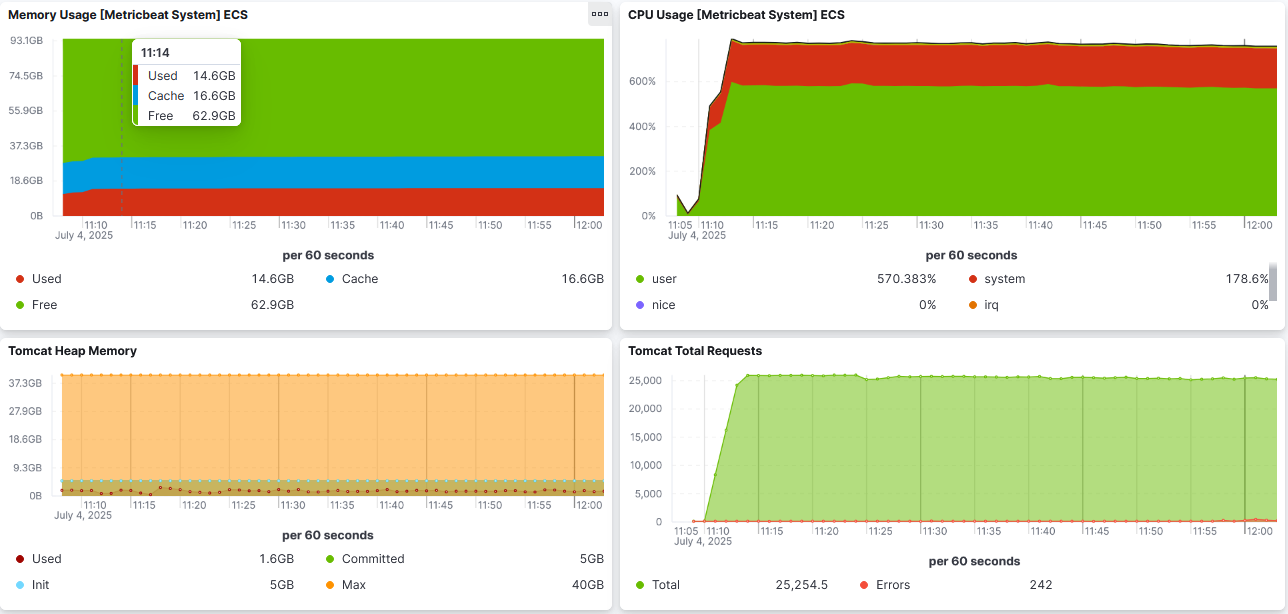
- If we switch to ZGC using the following settings
-XX:+UseZGC -XX:+ZGenerational -XX:SoftMaxHeapSize=20G -Xmx30G
then the memory consumption stabilizes somewhere around the max-heap setting:
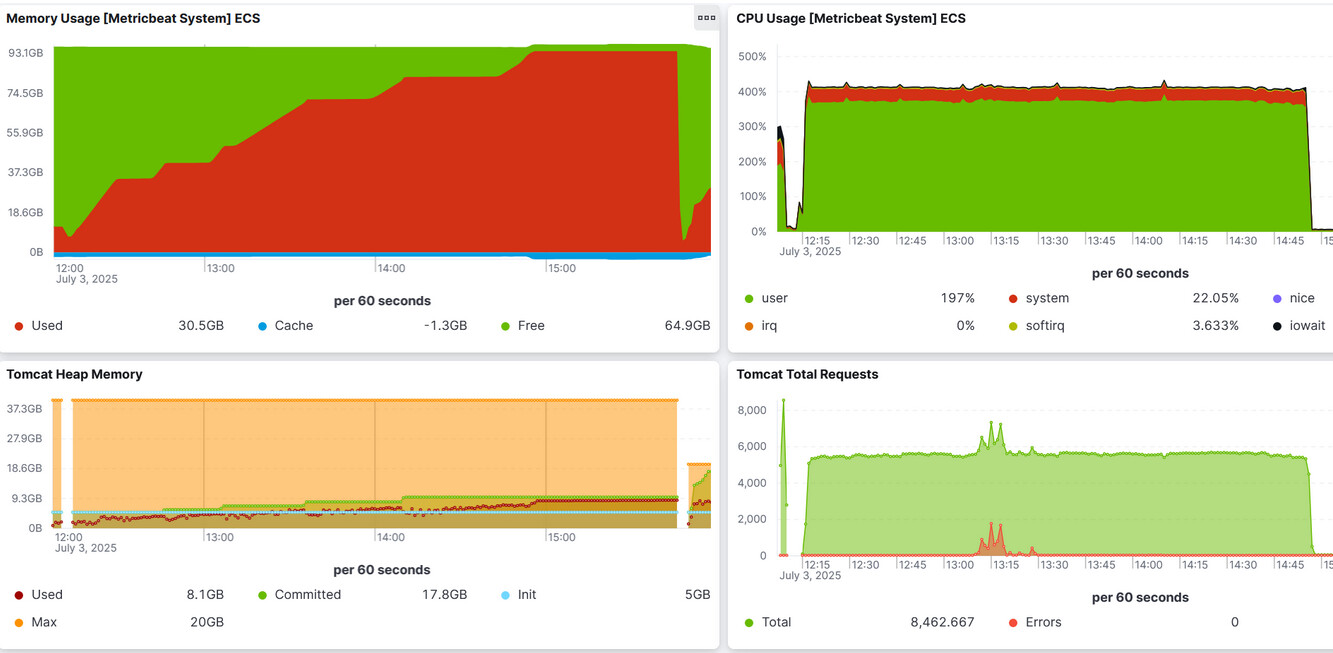
- If we stick with G1GC then the enabling of tile-recycling seems to have a similar workaround effect:
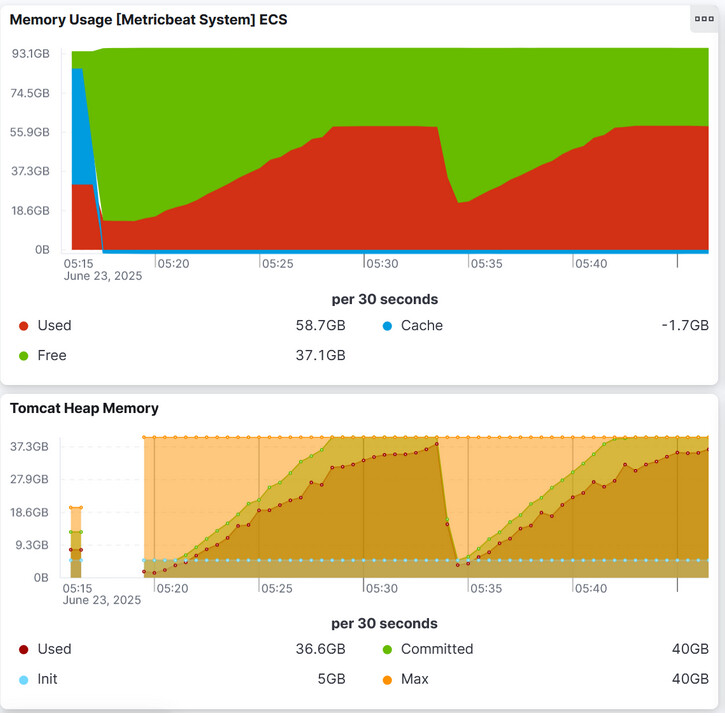
memory consumption increases fast, but the heap increases with it (most likely tile storage). Then at heap == max-heap, G1GC will perform a full GC run, and that seems to limit also the off-heap consumption.
One ting that can probably be noted is that by the metrics we captured, we are currently convinced that the problem does not seem to be a memory leak. Rather than that, it seems that something changed in GeoTools / GeoServer that dramatically changed the way native memory is consumed. Full GC runs (or at least a much more aggressive GC strategy) now seems to be required, in order to stabilize GeoServer’s memory consumption.
Async Profiling results
We also ran the async profiler tool: GitHub - async-profiler/async-profiler: Sampling CPU and HEAP profiler for Java featuring AsyncGetCallTrace + perf_events with native memory tracking:
./asprof start -e nativemem -f app.jfr <pid>
... wait until just before crash
./asprof stop -e nativemem -f app.jfr <pid>
The tracking showed some spots that seem to be consuming a lot native memory:
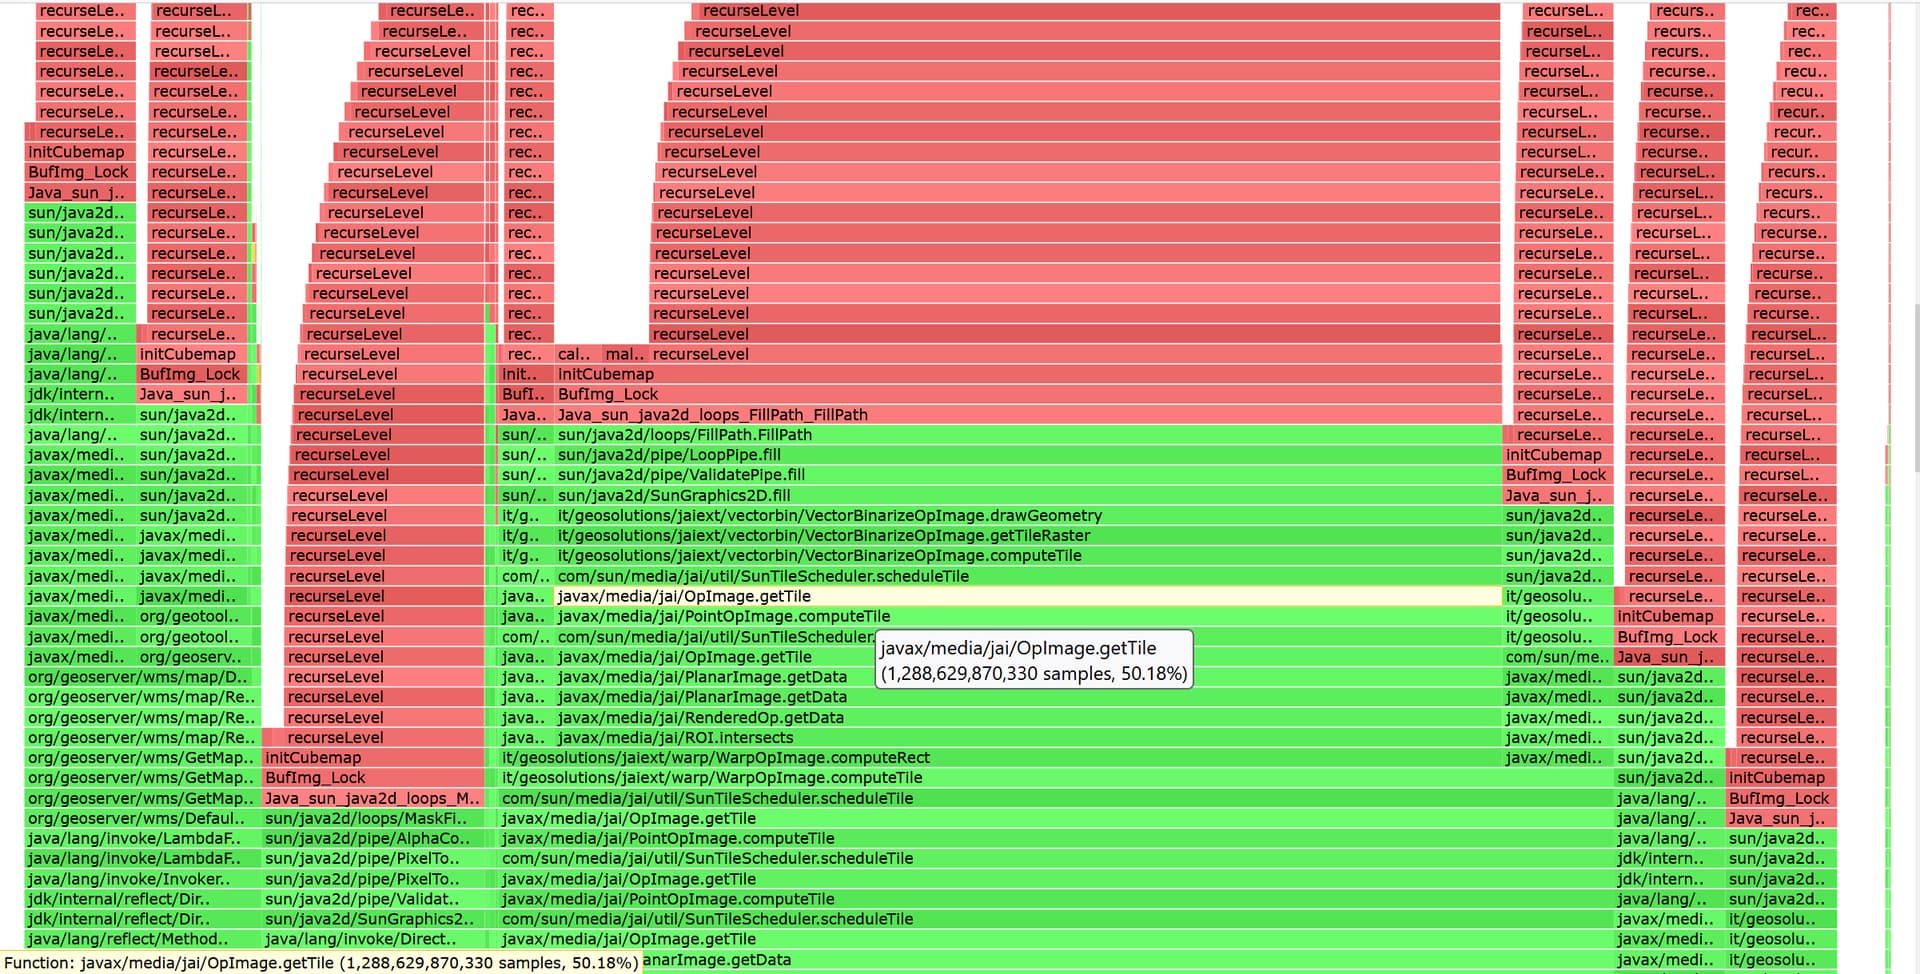
Leak detection points us to similar spots:
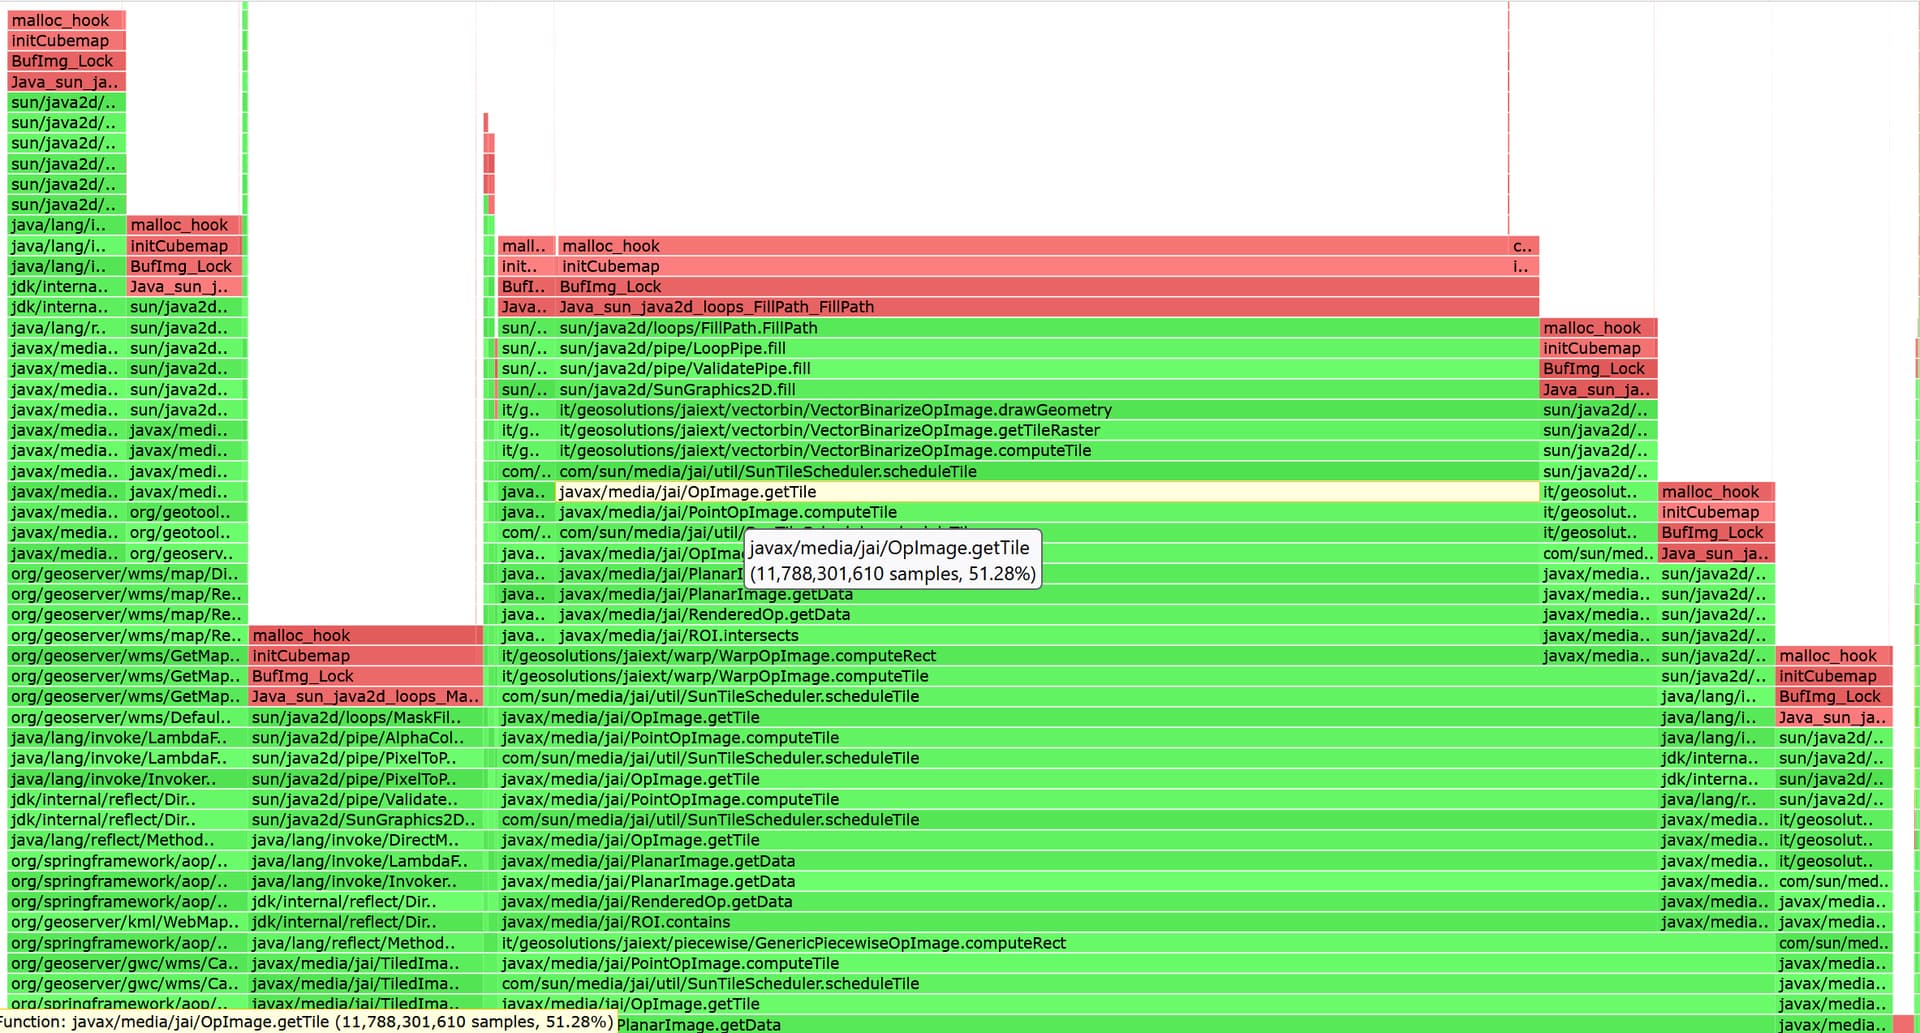
Unfortunately, we could not see any particular changes in GeoTools/GeoServer that would be affecting these spots. Also, the same analysis based on 2.23.6 showed very similar results.
JEMalloc
Finally we investigated into GitHub - jemalloc/jemalloc as it seems commmonly understood that Linux glibc malloc has a problem where it allocates native memory regions of an unfavourable size of 64MB, which could lead to native memory fragmentation.
This results in a memory curve as this:
- GS 2.27.1 + G1GC + Jemalloc + 30G maxHeap
Again, it looks like there’s not a particular memory leak, but more a weird change in the way memory is allocated and freed.
Tracing back to 2.24.0
We traced the problem back to 2.24.0, by going back from 2.27.x branches of GeoServer downwards (2.26.x, 2.25.x, 2.24.x). Finally the earliest version, that must have introduced the behaviour was 2.24.0, because going upward from 2.23.6 to 2.23.x did not show that behaviour at all.
Memory foot-print in 2.23.6
Finally, here comes a figure of how the consumption was in 2.23.6:
- initial heap: 10GB
- max-heap: 40MG
- garbage collection: G1GC
- tile-recycling: off
Summary
It seems that something between 2.23.x and 2.24.0 has changed with a dramatic impact on how off-heap memory is being used in GeoServer. Current analysis has made us conclude that it might not be a leak, but somehow a different behaviour that requires a more aggressive garbage collection strategy.
The only way we can currently survive is that we a using jemalloc + ZGC + a much decreased max-heap setting.
My question to the community + devs would be if anyone has made similar observations, or has any idea what might have caused the drastic change in behaviour.
Currently our goal is to try understand what’s going on there.
We are thankful for any suggestions / ideas.
Thanks!