Thanks for the help.
I’m not sure how to verify the pixel, but heres some more information about how I create the grid.
Initially I create an ascii grid file (below), I then use gdal to create the geotiff and post the geotiff to geoserver. Do you think geoserver is interpolating so that there are decimal values in between?
ncols 10
nrows 12
xllcorner 0.0
yllcorner 0.0
cellsize 0.18181818181818188
nodata_value 500000000.0
1.0 1.0 1.0 0.0 0.0 0.0 0.0 0.0 0.0 0.0
1.0 1.0 0.0 0.0 0.0 0.0 0.0 0.0 0.0 0.0
1.0 0.0 0.0 0.0 0.0 0.0 0.0 0.0 0.0 0.0
1.0 0.0 0.0 0.0 0.0 0.0 0.0 0.0 0.0 0.0
0.0 0.0 0.0 0.0 0.0 0.0 0.0 0.0 0.0 0.0
0.0 0.0 0.0 0.0 0.0 0.0 0.0 0.0 0.0 0.0
0.0 0.0 0.0 0.0 0.0 0.0 0.0 0.0 0.0 0.0
0.0 0.0 0.0 0.0 0.0 0.0 0.0 0.0 0.0 0.0
0.0 0.0 0.0 0.0 0.0 0.0 0.0 0.0 0.0 0.0
0.0 0.0 0.0 0.0 0.0 0.0 0.0 0.0 0.0 0.0
0.0 0.0 0.0 0.0 0.0 0.0 0.0 0.0 0.0 0.0
0.0 0.0 0.0 0.0 0.0 0.0 0.0 0.0 0.0 0.0
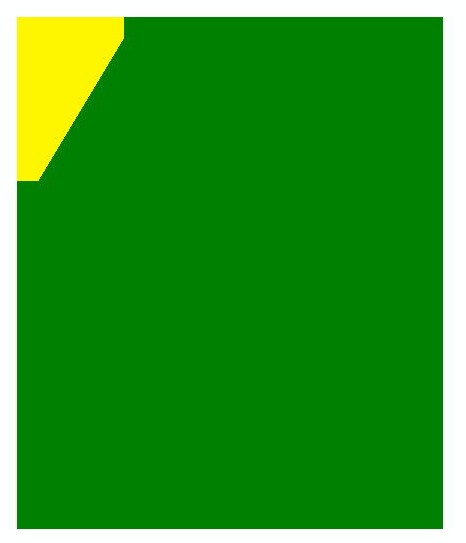
I changed the style and now I see the following picture (attached called image-intervals-sld)
<sld:ColorMap type=“intervals”>
<sld:ColorMapEntry color=“#008000” opacity=“1.0” quantity=“0.1” label=“No Impact”/>
<sld:ColorMapEntry color=“#FFF500” opacity=“1.0” quantity=“1.1” label=“Moderate Impact”/>
<sld:ColorMapEntry color=“#BBBBBB” opacity=“1.0” quantity=“2.1” label=“Missing Data”/>
<sld:ColorMapEntry color=“#FF0000” opacity=“1.0” quantity=“3.1” label=“Significant Impact”/>
</sld:ColorMap>
</sld:RasterSymbolizer>
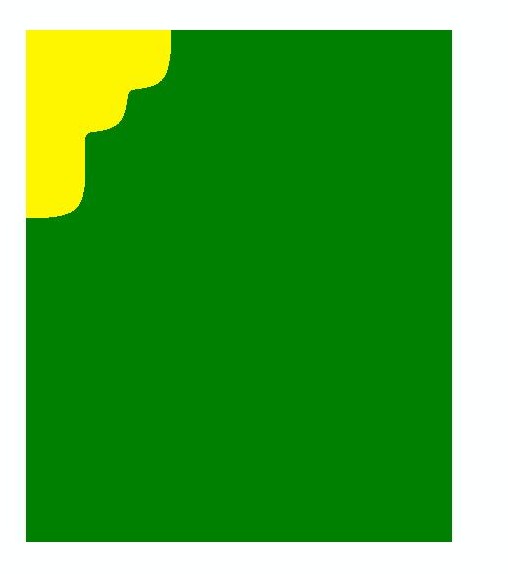
I also create another grid (attached image-rawdata) using a raw data ascii file in the same way (ascii ->gdal translate → geotiff → geoserver)
ncols 10
nrows 12
xllcorner 0.0
yllcorner 0.0
cellsize 0.18181818181818188
nodata_value 500000000.0
244.789 247.289 249.789 252.289 254.789 257.289 259.789 262.289 264.789 267.289
246.289 248.789 251.289 253.789 256.289 258.789 261.289 263.789 266.289 268.789
247.789 250.289 252.789 255.289 257.789 260.289 262.789 265.289 267.789 270.289
249.289 251.789 254.289 256.789 259.289 261.789 264.289 266.789 269.289 271.789
250.789 253.289 255.789 258.289 260.789 263.289 265.789 268.289 270.789 273.289
252.289 254.789 257.289 259.789 262.289 264.789 267.289 269.789 272.289 274.789
253.789 256.289 258.789 261.289 263.789 266.289 268.789 271.289 273.789 276.289
255.289 257.789 260.289 262.789 265.289 267.789 270.289 272.789 275.289 277.789
256.789 259.289 261.789 264.289 266.789 269.289 271.789 274.289 276.789 279.289
258.289 260.789 263.289 265.789 268.289 270.789 273.289 275.789 278.289 280.789
259.789 262.289 264.789 267.289 269.789 272.289 274.789 277.289 279.789 282.289
261.289 263.789 266.289 268.789 271.289 273.789 276.289 278.789 281.289 283.789
The styling for this grid uses intervals
<sld:ColorMap type=“intervals”>
<sld:ColorMapEntry color=“#FFF500” opacity=“1.0” quantity=“249.81666664444447” label=“249.81666664444447”/> //yellow
<sld:ColorMapEntry color=“#008000” opacity=“1.0” quantity=“400000000” label=“Max Possible Value”/> //green
<sld:ColorMapEntry color=“#BBBBBB” opacity=“1.0” quantity=“500000000” label=“Missing Data”/>
</sld:ColorMap>
Why do the grids look so different? Again is it how geoserver is interpolating the grids?
Dominique Bessette
Software Engineer
General Dynamics Information Technology
Office: 619-881-2748
···
On Wed, Jul 8, 2015 at 5:36 PM, Bessette-Halsema, Dominique E <Dominique.Bessette@…1196…> wrote:
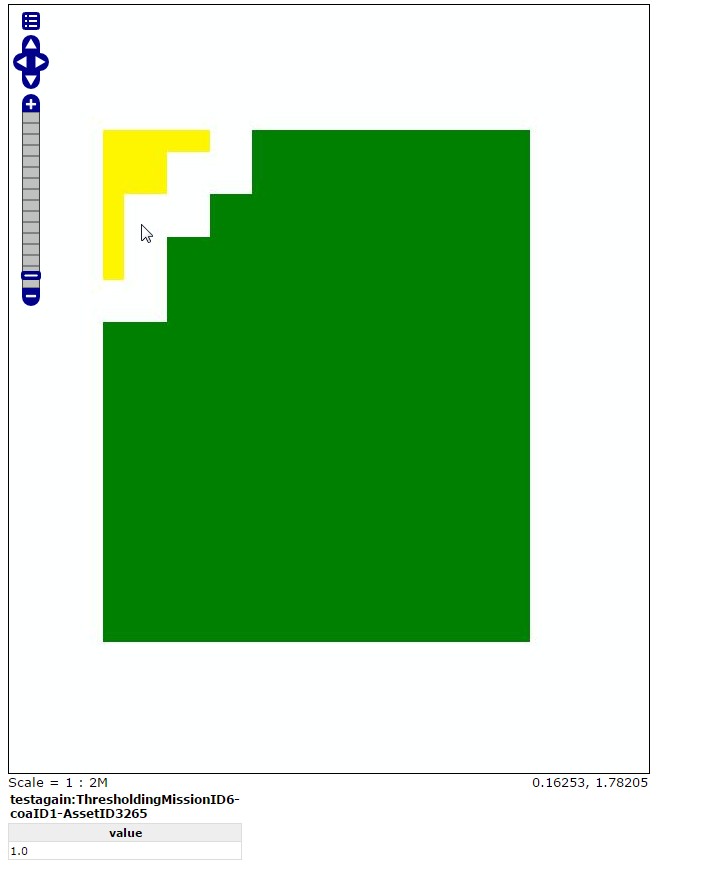
Sorry I didn’t mean the actual label. I meant the color in the raster should be yellow which is the Moderate Impact color.
The point value I clicked is 1.0 but there is not a style associated with it.
My style is as follows
<sld:ColorMap type=“values”>
<sld:ColorMapEntry color=“#008000” opacity=“1.0” quantity=“0.0” label=“No Impact”/>
<sld:ColorMapEntry color=“#FFF500” opacity=“1.0” quantity=“1.0” label=“Moderate Impact”/>
Hum… quantity = 1 here. So there is a style associated to it. Ah, from the screenshot it seems there is a translation between
the point you’re clicking, and where the GetFeatureInfo is actually picking the value.
You’re oversampling a lot there, it might be the “half pixel” issue, OGC wants us to use the center of the pixel as
the reference, most data uses the corner of the pixel instead.
We have machinery to go from one to the other, wondering if in some place in the GetFeatureInfo code chain
we are not applying it correctly (something one would notice only when oversampling something like 50-100
times compared to the native resolution)
Can you verify there is a predictable translation between pixel queried, and pixel you get in the response?
Cheers
Andrea
–
==
GeoServer Professional Services from the experts! Visit
http://goo.gl/it488V for more information.
==
Ing. Andrea Aime
@geowolf
Technical Lead
GeoSolutions S.A.S.
Via Poggio alle Viti 1187
55054 Massarosa (LU)
Italy
phone: +39 0584 962313
fax: +39 0584 1660272
mob: +39 339 8844549
http://www.geo-solutions.it
http://twitter.com/geosolutions_it
AVVERTENZE AI SENSI DEL D.Lgs. 196/2003
Le informazioni contenute in questo messaggio di posta elettronica e/o nel/i file/s allegato/i sono da considerarsi strettamente riservate. Il loro utilizzo è consentito esclusivamente al destinatario del messaggio, per le finalità indicate nel messaggio stesso. Qualora riceviate questo messaggio senza esserne il destinatario, Vi preghiamo cortesemente di darcene notizia via e-mail e di procedere alla distruzione del messaggio stesso, cancellandolo dal Vostro sistema. Conservare il messaggio stesso, divulgarlo anche in parte, distribuirlo ad altri soggetti, copiarlo, od utilizzarlo per finalità diverse, costituisce comportamento contrario ai principi dettati dal D.Lgs. 196/2003.
The information in this message and/or attachments, is intended solely for the attention and use of the named addressee(s) and may be confidential or proprietary in nature or covered by the provisions of privacy act (Legislative Decree June, 30 2003, no.196 - Italy’s New Data Protection Code).Any use not in accord with its purpose, any disclosure, reproduction, copying, distribution, or either dissemination, either whole or partial, is strictly forbidden except previous formal approval of the named addressee(s). If you are not the intended recipient, please contact immediately the sender by telephone, fax or e-mail and delete the information in this message that has been received in error. The sender does not give any warranty or accept liability as the content, accuracy or completeness of sent messages and accepts no responsibility for changes made after they were sent or for other risks which arise as a result of e-mail transmission, viruses, etc.