Hi,
I’ve installed a nightly version of Geoserver :
When I’m starting to generate the tiles from the web page : /geoserver/gwc/rest/seed/Map_layer_cache
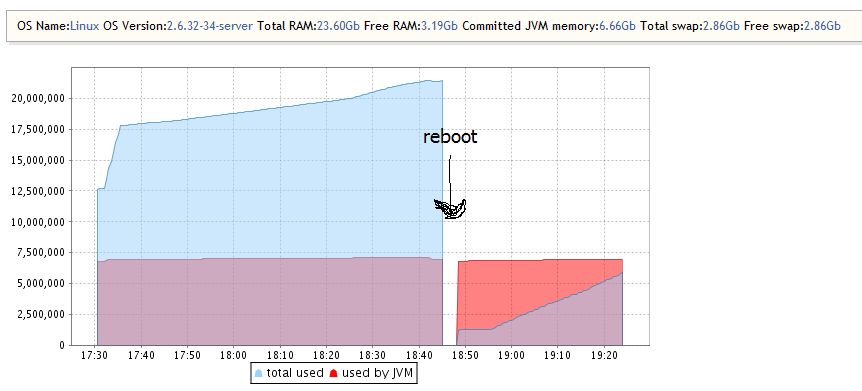
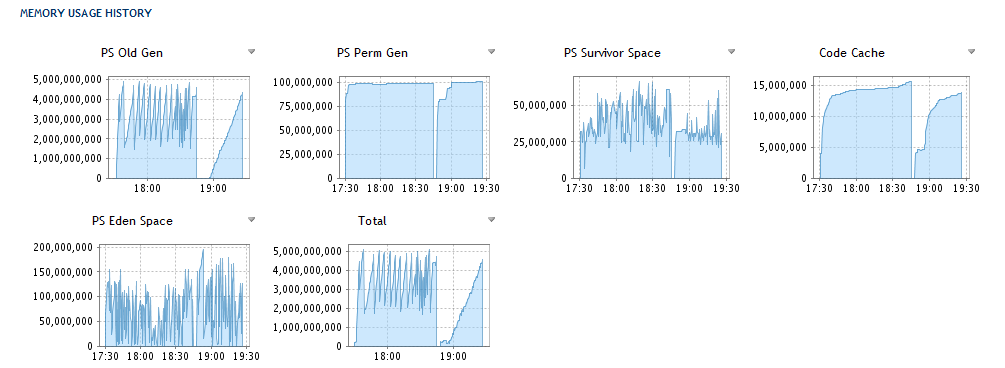
I’m detecting a memory leak : image memory leak .png & image memory leak 2.png
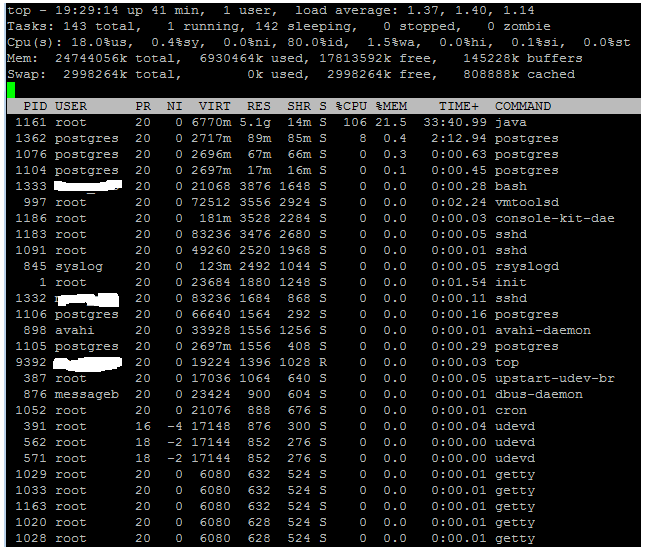
the picture memory leak 3.png show the result of the top command.
As you can see my data is stored in a postgis database hosted by postgres 9.1
Tomcat config :
JAVA_OPTS=“-Djava.awt.headless=true -Dfile.encoding=UTF-8 -server -Xms5000m -Xmx6000m -XX:NewSize=256m -XX:MaxNewSize=256m -XX:PermSize=256m -XX:MaxPermSize=256m -XX:+DisableExplicitGC -Dcom.sun.management.jmxremote=true”
Geoserver config :
Connections 1
Memory Usage 2 GB
Free memory
JVM Version Sun Microsystems Inc.: 1.6.0_26 (Java HotSpot™ 64-Bit Server VM)
Available Fonts GeoServer can access 63 different fonts. Full list of available fonts
Native JAI true
Native JAI ImageIO true
JAI Maximum Memory 2 GB
JAI Memory Usage 0 KB
Free memory
JAI Memory Threshold 75.0
Number of JAI Tile Threads 12
JAI Tile Thread Priority 5
ThreadPoolExecutor Core Pool Size 5
ThreadPoolExecutor Max Pool Size 40
ThreadPoolExecutor Keep Alive Time (ms) 30000
Update Sequence 197
Tile recycling disable
Server Ubuntu 10.04
can someone give me some lead ? Some help ?
Thanks,
On Fri, Oct 7, 2011 at 7:50 PM, Micka <mickamusset@anonymised.com> wrote:
can someone give me some lead ? Some help ?
Push GeoServer on the brink of the OOM again, and when the memory used is way
up use jmap to see what is consuming the memory:
http://docs.geoserver.org/latest/en/user/production/troubleshooting.html
jmap -histo:live <pid> | head -25
This should give us an idea of what is chewing up the memory
Cheers
Andrea
--
-------------------------------------------------------
Ing. Andrea Aime
GeoSolutions S.A.S.
Tech lead
Via Poggio alle Viti 1187
55054 Massarosa (LU)
Italy
phone: +39 0584 962313
fax: +39 0584 962313
http://www.geo-solutions.it
http://geo-solutions.blogspot.com/
http://www.youtube.com/user/GeoSolutionsIT
http://www.linkedin.com/in/andreaaime
http://twitter.com/geowolf
-------------------------------------------------------
Ok,
But I can’t because of :
However, if you are running Tomcat 6.x or 7.x, and using JDK 1.6.0_23 or 1.6.0_24, Tomcat process will not show up in the jps output, or jvisualvm screen. This is because Tomcat uses a custom java.io.tmpdir (-Djava.io.tmpdir=$CATALINA_BASE/temp) but jps and jvisualvm in JDK 1.6.0_23 or 1.6.0_24 always looks for java processes under the default java.io.tmpdir(the file hsperfdata_$USER). For more details, see https://issues.apache.org/bugzilla/show_bug.cgi?id=50518
So I don’t really know how to get the PID of tomcat and use the jmap command 
On Fri, Oct 7, 2011 at 8:19 PM, Andrea Aime <andrea.aime@anonymised.com> wrote:
On Fri, Oct 7, 2011 at 7:50 PM, Micka <mickamusset@anonymised.com> wrote:
can someone give me some lead ? Some help ?
Push GeoServer on the brink of the OOM again, and when the memory used is way
up use jmap to see what is consuming the memory:
http://docs.geoserver.org/latest/en/user/production/troubleshooting.html
jmap -histo:live | head -25
This should give us an idea of what is chewing up the memory
Cheers
Andrea
–
Ing. Andrea Aime
GeoSolutions S.A.S.
Tech lead
Via Poggio alle Viti 1187
55054 Massarosa (LU)
Italy
phone: +39 0584 962313
fax: +39 0584 962313
http://www.geo-solutions.it
http://geo-solutions.blogspot.com/
http://www.youtube.com/user/GeoSolutionsIT
http://www.linkedin.com/in/andreaaime
http://twitter.com/geowolf
Ok, I got it ( thx to aaime :
to find out the pid : ps aux | grep java | grep tomcat
and the result of the command “'sudo jmap -histo:live 1161 | head -25” is :
sudo jmap -histo:live 1161 | head -25
num #instances #bytes class name
1: 52174 568147880 [B
2: 21884 249481904 [I
3: 143385 23236400
4: 143385 19519080
5: 13757 16819968
6: 122508 13104872 [C
7: 216022 11762864
8: 13757 11205368
9: 11346 9630928
10: 8395 4569688
11: 133527 4272864 java.lang.String
12: 25546 2368872 [Ljava.util.HashMap$Entry;
13: 57369 2294760 org.hsqldb.DiskNode
14: 2938 2022632 [J
15: 25698 1803264 [Ljava.lang.Object;
16: 51340 1642880 java.util.HashMap$Entry
17: 14690 1527760 java.lang.Class
18: 20440 1375632 [S
19: 14809 1303192 java.lang.reflect.Method
20: 165 1055472 [D
21: 21276 1047400 [[I
22: 18865 905520 java.util.HashMap
~$ sudo jmap -histo:live 1161 | head -25
num #instances #bytes class name
1: 52048 92517792 [B
2: 143385 23236400
3: 143385 19519080
4: 13757 16819968
5: 120920 12982400 [C
6: 216022 11762864
7: 13757 11205368
8: 11346 9630928
9: 8395 4569688
10: 131984 4223488 java.lang.String
11: 20012 2718024 [I
12: 25501 2365496 [Ljava.util.HashMap$Entry;
13: 57369 2294760 org.hsqldb.DiskNode
14: 2988 2022216 [J
15: 26013 1774800 [Ljava.lang.Object;
16: 49574 1586368 java.util.HashMap$Entry
17: 14690 1527760 java.lang.Class
18: 20438 1375584 [S
19: 14809 1303192 java.lang.reflect.Method
20: 21276 1047400 [[I
21: 18886 906528 java.util.HashMap
22: 1430 736976 [[B
On Mon, Oct 10, 2011 at 3:00 PM, Micka <mickamusset@…84…> wrote:
Ok,
But I can’t because of :
However, if you are running Tomcat 6.x or 7.x, and using JDK 1.6.0_23 or 1.6.0_24, Tomcat process will not show up in the jps output, or jvisualvm screen. This is because Tomcat uses a custom java.io.tmpdir (-Djava.io.tmpdir=$CATALINA_BASE/temp) but jps and jvisualvm in JDK 1.6.0_23 or 1.6.0_24 always looks for java processes under the default java.io.tmpdir(the file hsperfdata_$USER). For more details, see https://issues.apache.org/bugzilla/show_bug.cgi?id=50518
So I don’t really know how to get the PID of tomcat and use the jmap command
On Fri, Oct 7, 2011 at 8:19 PM, Andrea Aime <andrea.aime@…1107…> wrote:
On Fri, Oct 7, 2011 at 7:50 PM, Micka <mickamusset@…84…> wrote:
can someone give me some lead ? Some help ?
Push GeoServer on the brink of the OOM again, and when the memory used is way
up use jmap to see what is consuming the memory:
http://docs.geoserver.org/latest/en/user/production/troubleshooting.html
jmap -histo:live | head -25
This should give us an idea of what is chewing up the memory
Cheers
Andrea
–
Ing. Andrea Aime
GeoSolutions S.A.S.
Tech lead
Via Poggio alle Viti 1187
55054 Massarosa (LU)
Italy
phone: +39 0584 962313
fax: +39 0584 962313
http://www.geo-solutions.it
http://geo-solutions.blogspot.com/
http://www.youtube.com/user/GeoSolutionsIT
http://www.linkedin.com/in/andreaaime
http://twitter.com/geowolf
here is an another result of the command :
num #instances #bytes class name
1: 51870 29907984 [B
2: 143385 23236400
3: 143385 19519080
4: 13757 16819968
5: 118676 12751704 [C
6: 216022 11762864
7: 13757 11205368
8: 11346 9630928
9: 8395 4569688
10: 129805 4153760 java.lang.String
11: 19434 2693176 [I
12: 57369 2294760 org.hsqldb.DiskNode
13: 24426 2278656 [Ljava.util.HashMap$Entry;
14: 2904 2015496 [J
15: 24869 1726120 [Ljava.lang.Object;
16: 14690 1527760 java.lang.Class
17: 46247 1479904 java.util.HashMap$Entry
18: 20437 1375560 [S
19: 14809 1303192 java.lang.reflect.Method
20: 21276 1047400 [[I
21: 17839 856272 java.util.HashMap
22: 1403 734312 [[B
and the actual memory state of the server :
http://imageshack.us/photo/my-images/571/memoryleak4.png/
On Mon, Oct 10, 2011 at 3:16 PM, Micka <mickamusset@…84…> wrote:
Ok, I got it ( thx to aaime :
to find out the pid : ps aux | grep java | grep tomcat
and the result of the command “'sudo jmap -histo:live 1161 | head -25” is :
sudo jmap -histo:live 1161 | head -25
num #instances #bytes class name
1: 52174 568147880 [B
2: 21884 249481904 [I
3: 143385 23236400
4: 143385 19519080
5: 13757 16819968
6: 122508 13104872 [C
7: 216022 11762864
8: 13757 11205368
9: 11346 9630928
10: 8395 4569688
11: 133527 4272864 java.lang.String
12: 25546 2368872 [Ljava.util.HashMap$Entry;
13: 57369 2294760 org.hsqldb.DiskNode
14: 2938 2022632 [J
15: 25698 1803264 [Ljava.lang.Object;
16: 51340 1642880 java.util.HashMap$Entry
17: 14690 1527760 java.lang.Class
18: 20440 1375632 [S
19: 14809 1303192 java.lang.reflect.Method
20: 165 1055472 [D
21: 21276 1047400 [[I
22: 18865 905520 java.util.HashMap
~$ sudo jmap -histo:live 1161 | head -25
num #instances #bytes class name
1: 52048 92517792 [B
2: 143385 23236400
3: 143385 19519080
4: 13757 16819968
5: 120920 12982400 [C
6: 216022 11762864
7: 13757 11205368
8: 11346 9630928
9: 8395 4569688
10: 131984 4223488 java.lang.String
11: 20012 2718024 [I
12: 25501 2365496 [Ljava.util.HashMap$Entry;
13: 57369 2294760 org.hsqldb.DiskNode
14: 2988 2022216 [J
15: 26013 1774800 [Ljava.lang.Object;
16: 49574 1586368 java.util.HashMap$Entry
17: 14690 1527760 java.lang.Class
18: 20438 1375584 [S
19: 14809 1303192 java.lang.reflect.Method
20: 21276 1047400 [[I
21: 18886 906528 java.util.HashMap
22: 1430 736976 [[B
On Mon, Oct 10, 2011 at 3:00 PM, Micka <mickamusset@…84…> wrote:
Ok,
But I can’t because of :
However, if you are running Tomcat 6.x or 7.x, and using JDK 1.6.0_23 or 1.6.0_24, Tomcat process will not show up in the jps output, or jvisualvm screen. This is because Tomcat uses a custom java.io.tmpdir (-Djava.io.tmpdir=$CATALINA_BASE/temp) but jps and jvisualvm in JDK 1.6.0_23 or 1.6.0_24 always looks for java processes under the default java.io.tmpdir(the file hsperfdata_$USER). For more details, see https://issues.apache.org/bugzilla/show_bug.cgi?id=50518
So I don’t really know how to get the PID of tomcat and use the jmap command
On Fri, Oct 7, 2011 at 8:19 PM, Andrea Aime <andrea.aime@…1107…> wrote:
On Fri, Oct 7, 2011 at 7:50 PM, Micka <mickamusset@…84…> wrote:
can someone give me some lead ? Some help ?
Push GeoServer on the brink of the OOM again, and when the memory used is way
up use jmap to see what is consuming the memory:
http://docs.geoserver.org/latest/en/user/production/troubleshooting.html
jmap -histo:live | head -25
This should give us an idea of what is chewing up the memory
Cheers
Andrea
–
Ing. Andrea Aime
GeoSolutions S.A.S.
Tech lead
Via Poggio alle Viti 1187
55054 Massarosa (LU)
Italy
phone: +39 0584 962313
fax: +39 0584 962313
http://www.geo-solutions.it
http://geo-solutions.blogspot.com/
http://www.youtube.com/user/GeoSolutionsIT
http://www.linkedin.com/in/andreaaime
http://twitter.com/geowolf
yes,
It is what it looks like, but if it is not jvm, where does it come from ? Postgres 9.1 ?
What should I do ?
On Mon, Oct 10, 2011 at 3:24 PM, Charles Galpin <cgalpin@anonymised.com> wrote:
On Oct 10, 2011, at 9:21 AM, Micka wrote:
and the actual memory state of the server :
http://imageshack.us/photo/my-images/571/memoryleak4.png/
Micka, this shows the JVM memory use is constant.
Really not sure. Are you showing the graphs at the point where it’s about to run out of memory? All I can tell you is the graph you show does not indicate memory use increasing in the jvm. Is the memory limit set to 7Gb or higher?
I forget what the initial issue was, but if it was a OOM exception in the jvm, then other system use (file caching, postgres etc) shouldn’t be an issue as this is just the jvm hitting it’s configured limit. Your system clearly has plenty of memory free.
charles
On Oct 10, 2011, at 9:27 AM, Micka wrote:
yes,
It is what it looks like, but if it is not jvm, where does it come from ? Postgres 9.1 ?
What should I do ?
On Mon, Oct 10, 2011 at 3:24 PM, Charles Galpin <cgalpin@anonymised.com> wrote:
On Oct 10, 2011, at 9:21 AM, Micka wrote:
and the actual memory state of the server :
http://imageshack.us/photo/my-images/571/memoryleak4.png/
Micka, this shows the JVM memory use is constant.
On Mon, Oct 10, 2011 at 3:21 PM, Micka <mickamusset@anonymised.com> wrote:
here is an another result of the command :
num #instances #bytes class name
----------------------------------------------
1: 51870 29907984 [B
2: 143385 23236400 <constMethodKlass>
3: 143385 19519080 <methodKlass>
4: 13757 16819968 <constantPoolKlass>
In all the dumps you showed the memory used by the byte and int,
which store image
tiles, but none of them shows too large memory usage, the values I see
go between
30 and 100MB
Let's get back a moment... how do you determine there is a memory leak?
A memory leak in java always results in the server throwing an endless
number of
OOM execptions (which are logged in the logs), the moment it starts
throwing them
it does not stop.
If you assume there is a leak because the memory used by the JVM grows, that's
not it: any JVM under pressure (you're seeding the tile cache) will
allocate more and
more memory until it reaches the limits set by -Xmx, and it's very
unlikely that it
will ever give it back.
So the normal situation is that you see the JVM use more and more memory for
a while, but then it stops and hovers at the same memory usage (as seen from the
OS) ever after
Cheers
Andrea
--
-------------------------------------------------------
Ing. Andrea Aime
GeoSolutions S.A.S.
Tech lead
Via Poggio alle Viti 1187
55054 Massarosa (LU)
Italy
phone: +39 0584 962313
fax: +39 0584 962313
http://www.geo-solutions.it
http://geo-solutions.blogspot.com/
http://www.youtube.com/user/GeoSolutionsIT
http://www.linkedin.com/in/andreaaime
http://twitter.com/geowolf
-------------------------------------------------------