Hi Kevin,
I guess it is a problem with your region. Once you imported your four ascii files into your mapset, you have to define a region to fit the extension and resolution of your four raster layers, before performing any kind of analysis.
So, you should execute the following command in order to adapt your region to your files:
$ g.region rast=MNT_Kourou_50cm_000552,MNT_Kourou_50cm_000551,MNT_Kourou_50cm_000517,MNT_Kourou_50cm_000518
Then you can patch your raster files into a single raster layer:
$ r.patch input=MNT_Kourou_50cm_000552,MNT_Kourou_50cm_000551,MNT_Kourou_50cm_000517,MNT_Kourou_50cm_000518 out=MNT_Kourou_50cm_patch
And finally apply the r.contour tool.
Hope this helps!
Cheers,
Lluís
El dc 21 de 02 de 2018 a les 07:31 -0300, en/na Kevin Labre va escriure:
Dear list,
I’m quite new to GRASS and Ubuntu, it might be an easy question.
I’m trying to display contour lines on a map of the piece of land I’m buying.
The data used is 4 .asc files with respective .prj files created under ARCGis on Windows, projection RGFG95 UTM 22N. They’re imported into Grass using the r.import command.
I can load them and managed to display contour lines using r.contour on one or the other, but not the four tiles altogether:
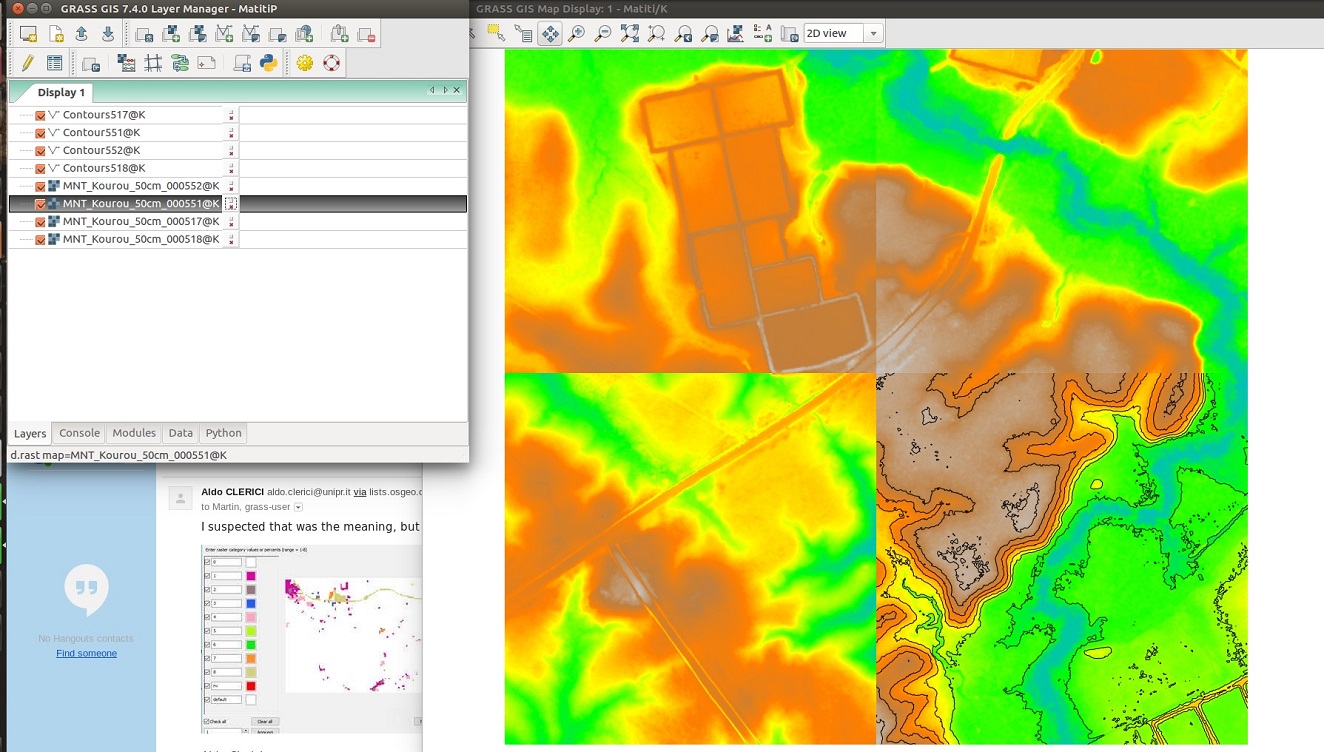
Are there any steps I’m missing?
Thanks for your time!
Kevin
_______________________________________________
grass-user mailing list
[grass-user@lists.osgeo.org](mailto:grass-user@lists.osgeo.org)
[https://lists.osgeo.org/mailman/listinfo/grass-user](https://lists.osgeo.org/mailman/listinfo/grass-user)
–
Lluís Vicens
Servei de Sistemes d’Informació Geogràfica
Universitat de Girona - SIGTE
Pl. Ferrater Mora 1
17071 Girona
Tel +34 972 418 039 (7025 intern)
lluis.vicens@udg.edu
Lloc web: http://www.sigte.udg.edu
Twitter: http://twitter.com/SIGTE_UDG