On Fri, Aug 26, 2016 at 9:41 AM, Micha Silver <micha@arava.co.il> wrote:
Hi Markus
------ Original Message ------ Subject: Re: [GRASS-user] flow accumulation
values Date: Thu, 25 Aug 2016 19:54:59 +0200 To: Ken Mankoff, Micha Silver,
Grass-user From: Markus Metz
On Thu, Aug 25, 2016 at 4:07 PM, Ken Mankoff <mankoff@gmail.com> wrote:
Is this MFD or SFD? If MFD, flow may split and re-join.
Exactly. With MFD, flow may be distributed to several downstream cells
and the accumulation value can drop when following the extracted path.
This is is most prominent when a river flows into an ocean. Paths,
however, follow Horton's stream network logic and can not split, only
join.
So what would be the correct way to get total flow accumulation for each
stream segment?
Do I have to revert to running r.watershed with the SFD flag?
Probably yes. For MFD, streams can be more than one cell wide, and you
would need to draw a cross-section at the beginning and end of each
stream segment, then sum up all stream cells for each cross-section.
I also noticed that r.stream.extract finds different flow-paths than
r.watershed, which complicates comparisons between the two. The work-around
for this is to use a mask to force r.stream.extract to find the flow-path
you want.
r.stream.extract is the preferred stream extraction tool.
OK, but a flow accum raster is required for running r.stream.order (which
outputs flow_accum) and AFAIK, the only way to get a flow_accum raster is
with r.watershed.
??
Correct. Extracting a stream network needs flow accumulation and
elevation as input. Thus the workflow would be 1) r.watershed to get
flow accumulation, 2) r.stream.extract to get the stream network, 3)
r.stream.order.
Markus M
Best,
Micha
Markus M
-k.
On 2016-08-25 at 13:35, Micha Silver <micha@arava.co.il> wrote:
I noticed something today that I don't understand. When I run
r.watershed and calculate the flow accumulation raster, I expect that
along each stream, in the direction of flow, accumulation values will
always be higher from one cell to the next. But I see this is not the
case. Sometimes, along a stream, the accumulation will drop for one
cell, then "jump up" again a few cells downstream.
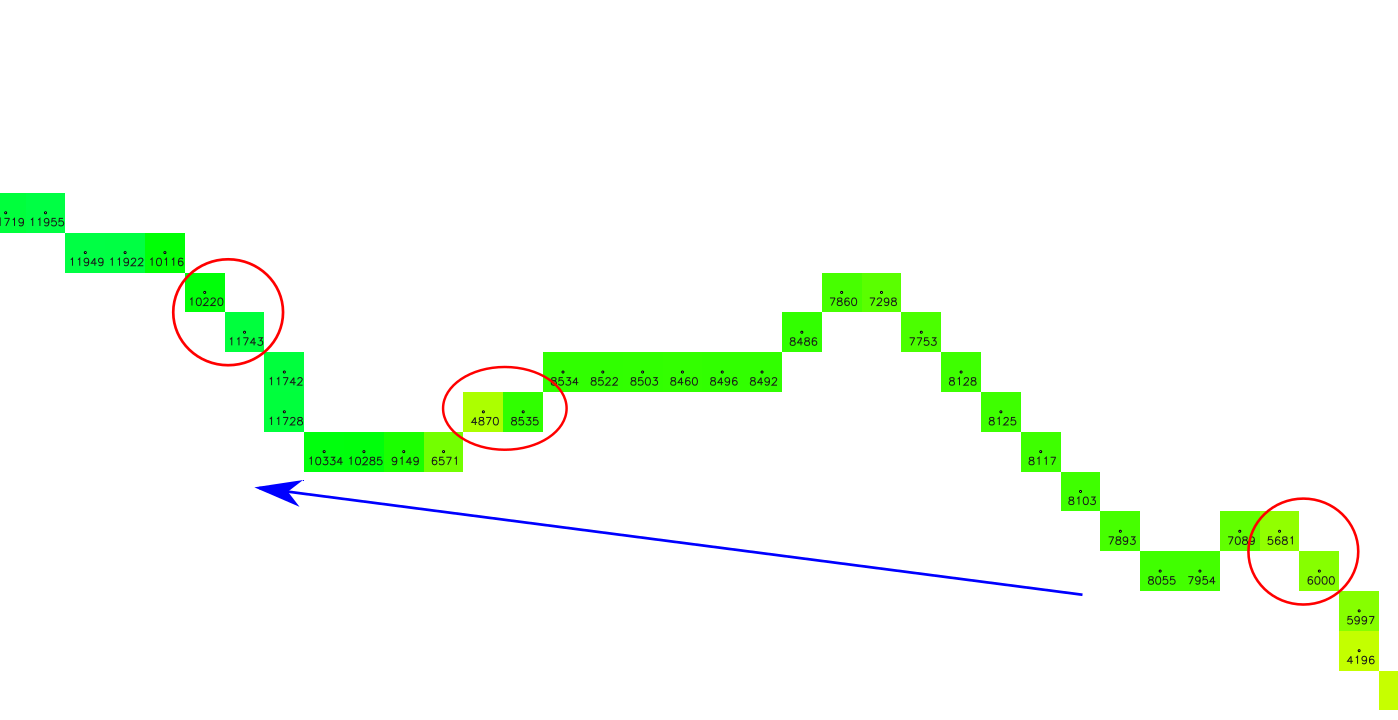
See the attached image. The green squares are clipped from a flow
accum grid. And the numbers are flow accum values. The arrow is
general flow direction, and the circles show examples of a sudden drop
in flow accum.
I'm aware of the "edge of map" behavior where out of region accum gets
a negative value. That's not the issue here, since the sample in the
attached image is from right in the center of the region, no off map
flow is involved.
This problem surfaced in a script I've prepared to calculate total
flow accumulation for each stream reach. After running the addon
r.stream.order I add columns to the streams vector map for X-Y of the
end points and total flow for each reach, then I use v.what.rast to
get the flow accum at each stream reach end-point. But the values I'm
getting are strange. Sometimes a downstream reach shows lower total
accum than the previous, upstream segment.
Maybe someone can shed some light?
Thanks, Micha
_______________________________________________
grass-user mailing list
grass-user@lists.osgeo.org
http://lists.osgeo.org/mailman/listinfo/grass-user