Hi Martin,
grass has a topological management of vector maps...
grass uses "lines" to define terrain elements like streams, roads, and
so on (linear features)
grass uses "boundaries" to define areas...
boundaries are special kinds of lines that should be close on themselfe
or on other boundaries...
if you have a map containing only a boundary closed on itself then you
probably have:
Number of nodes : 1
Number of primitives: 1
Number of points : 0
Number of lines : 0
Number of boundaries: 1
Number of centroids : 0
Number of areas : 1
Number of isles : 1
Number of areas without centroid : 1
instead, if you put a centroid inside this area:
Number of nodes : 2
Number of primitives: 2
Number of points : 0
Number of lines : 0
Number of boundaries: 1
Number of centroids : 1
Number of areas : 1
Number of isles : 1
the centroid gives the category and the attributes to the area defined
by the sourronding boundaries...
so, usually, you can have an area without centroid only if this area
represents an hole (for example a lake in a vegetational map, since in
the water I consider there aren't plants)
in your case you have:
4010 primitives (2042 boundaries + 1968 centroids)
the boundaries define 1983 areas
but we have 1968 centroids
so there are probably 15 holes...
the holes can exists.. in effect... (for example lakes or internal seas)
this to explain the results of v.build...
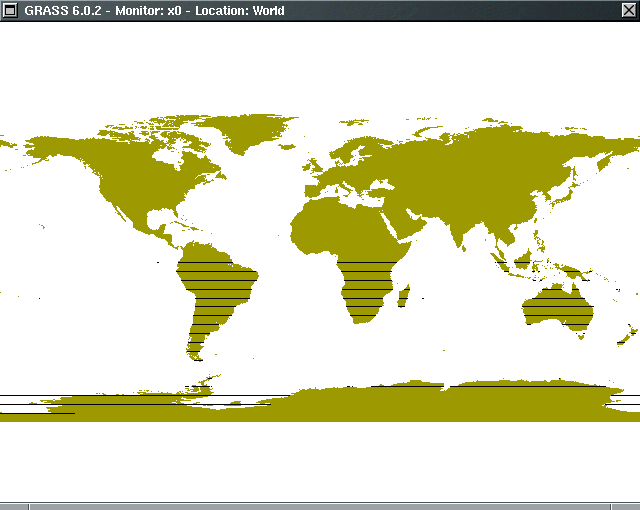
but this doesn't explain the reason of the strange overlay...
why did you try to do all the intersection line for line...
why didn't you create a single "lines map" that contain all the
latitudes and then perform the overlay?
May be I'm missing something but I can't explain this result...
sorry...
can someone else try to give an explanation?
Ivan
Il giorno ven, 02/11/2007 alle 17.33 +0100, Martin Bley ha scritto:
Hi Ivan,
thanks for your answer
On Fri, Nov 02, 2007 at 12:51:50PM +0100, ivan marchesini wrote:
> hmmm
> really strange...
> did you verify the topology of the world map?
>
> v.build map=$map
GRASS 6.0.2 (World):~ > v.build map=World
Building topology ...
4010 primitives registered
Building areas: 100%
1983 areas built
1953 isles built
Attaching islands: 100%
Attaching centroids: 100%
Topology was built.
Number of nodes : 3980
Number of primitives: 4010
Number of points : 0
Number of lines : 0
Number of boundaries: 2042
Number of centroids : 1968
Number of areas : 1983
Number of isles : 1953
Number of areas without centroid : 15
GRASS 6.0.2 (World):~ >
don't know what to do with this information. What about the 15 "areas
without centroid"?
I just started a new v.overlay operation after building ithe topology
using v.build - same effect.
Thanks,
Martin
--
Ti prego di cercare di non inviarmi files .doc, .xls, .ppt, .dwg.
Preferisco formati liberi.
Please try to avoid to send me .doc, .xls, .ppt, .dwg files.
I prefer free formats.
http://it.wikipedia.org/wiki/Formato_aperto
http://en.wikipedia.org/wiki/Open_format
Ivan Marchesini
Department of Civil and Environmental Engineering
University of Perugia
Via G. Duranti 93/a
06125
Perugia (Italy)
Socio fondatore GFOSS "Geospatial Free and Open Source Software" http://www.gfoss.it
e-mail: marchesini@unipg.it
ivan.marchesini@gmail.com
tel: +39(0)755853760
fax (university): +39(0)755853756
fax (home): +39(0)5782830887
jabber: geoivan73@jabber.org