Dear Micha
Ah I see your suggestion for
# Create raster for zones, all quadrats with the same value
$ v.to.rast input=quadrat output=quadrat use=val value=1
- Is it possible to plot several squares/classes with v.to.rast? So something similar to Fig 1 (all squaraes) or just the squares with values in the raster file “al_pres_apple_spring_merged.tif”?
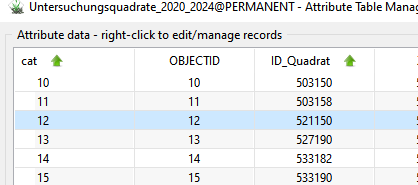
- To challenge with fig 1 is that the assignment of “ID_Quadrat” to the values in the raster file “al_pres_apple_spring_merged.tif” is wrong. Instead of “value 1” I would like the assignment to “ID_Quadrat” similar to fig 1. For example I do not have values for the last one, “737182”. The order is somehow mixed-up.
Kind regards
Sibylle
Fig 1
From: Micha Silver tsvibar@gmail.com
Sent: Monday, June 3, 2024 3:11 PM
To: sibylle.stoeckli@gmx.ch; grass-user@lists.osgeo.org; p.vanbreugel@gmail.com
Subject: Re: [GRASS-user] raster boxplots wrong assignment
Hi Sibylle:
So the problem is getting all the vector quadrats as a single value into the “zones” raster? Then I would use the parameters:
‘attr=val value=1’ in the v.to.rast step.
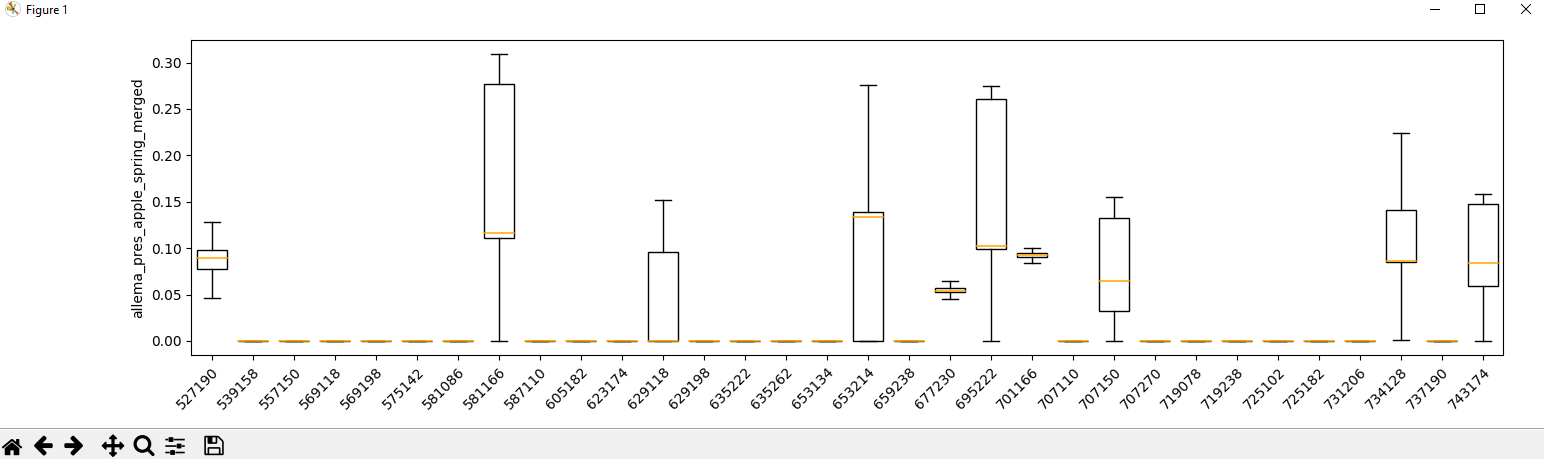
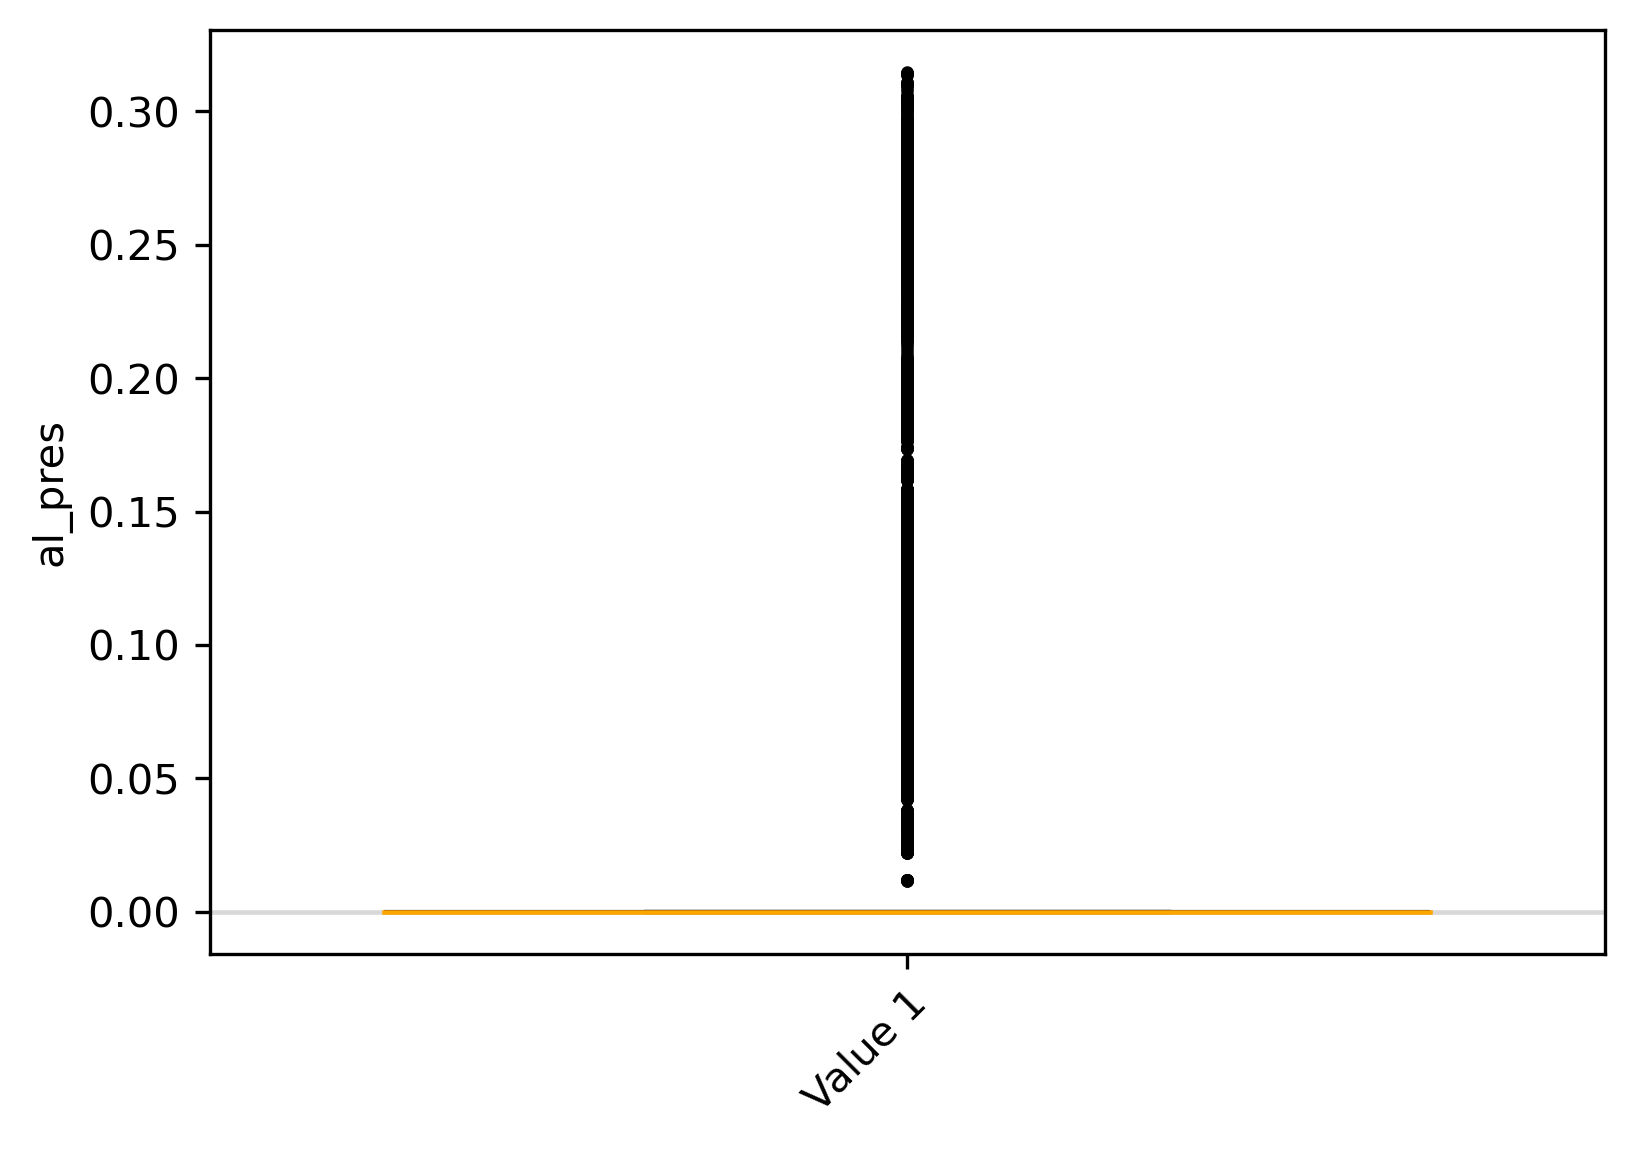
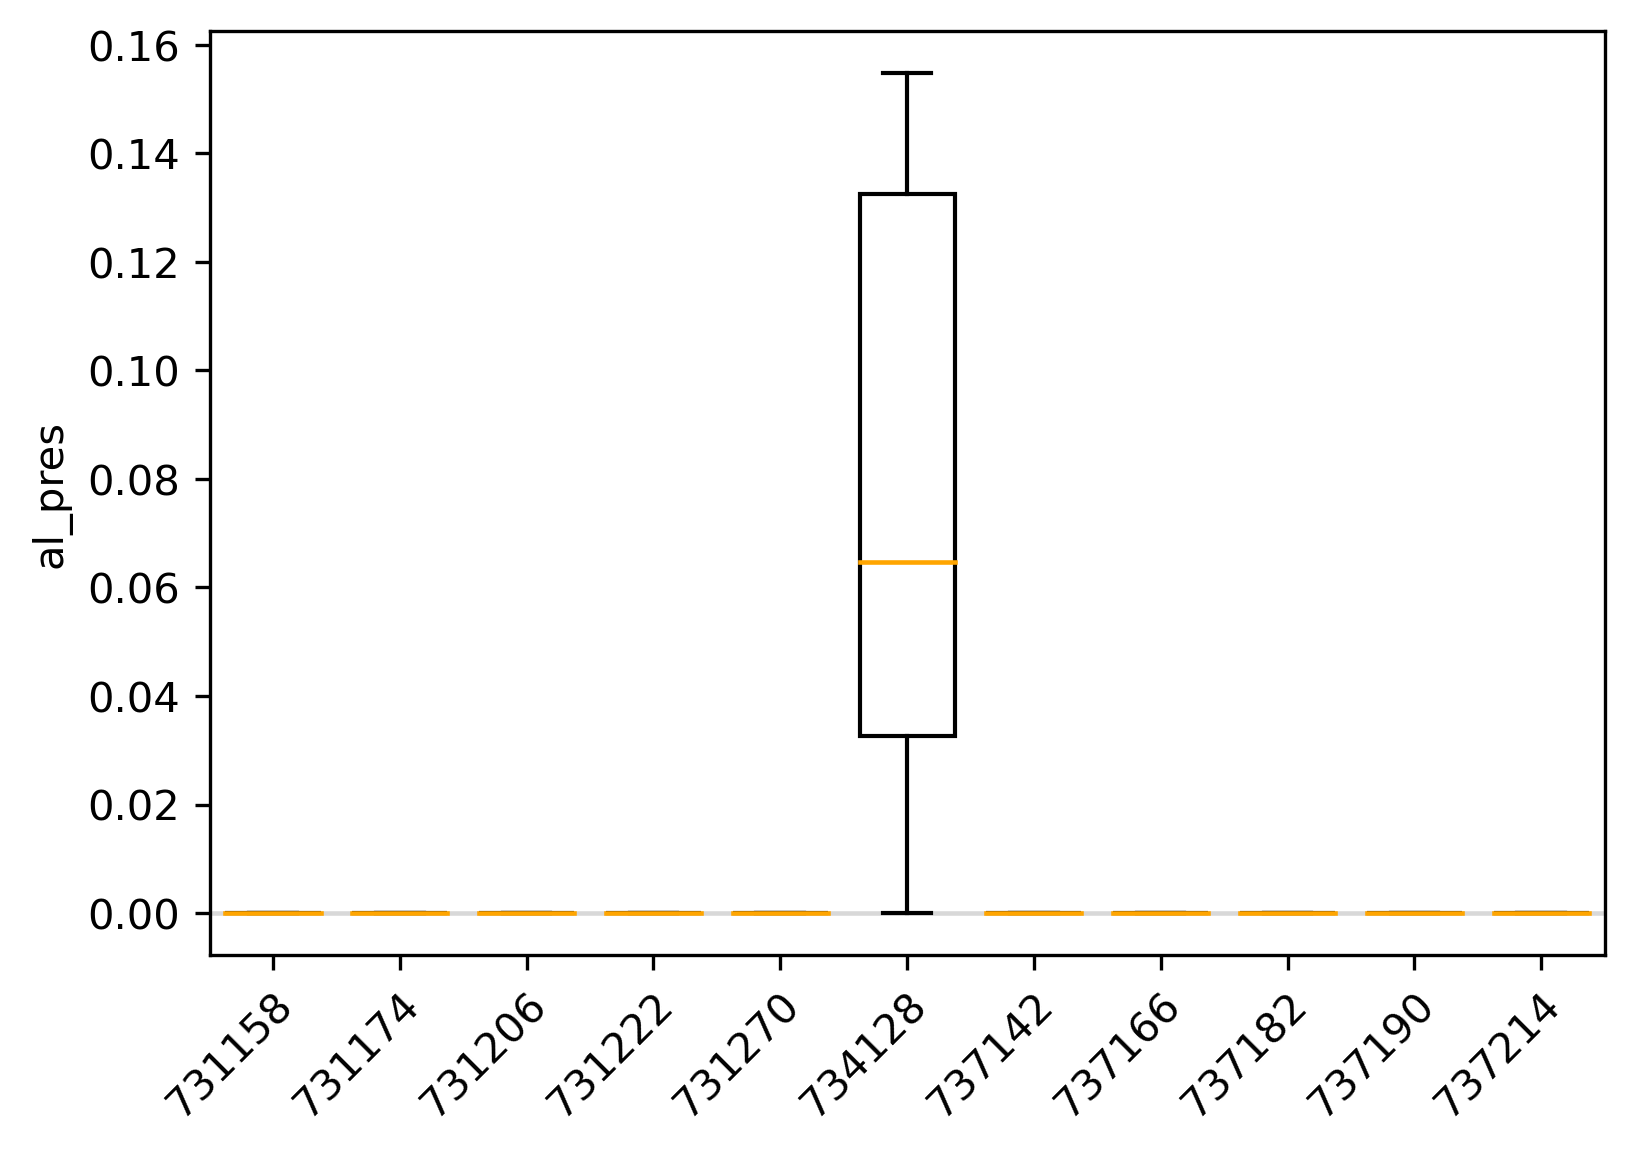
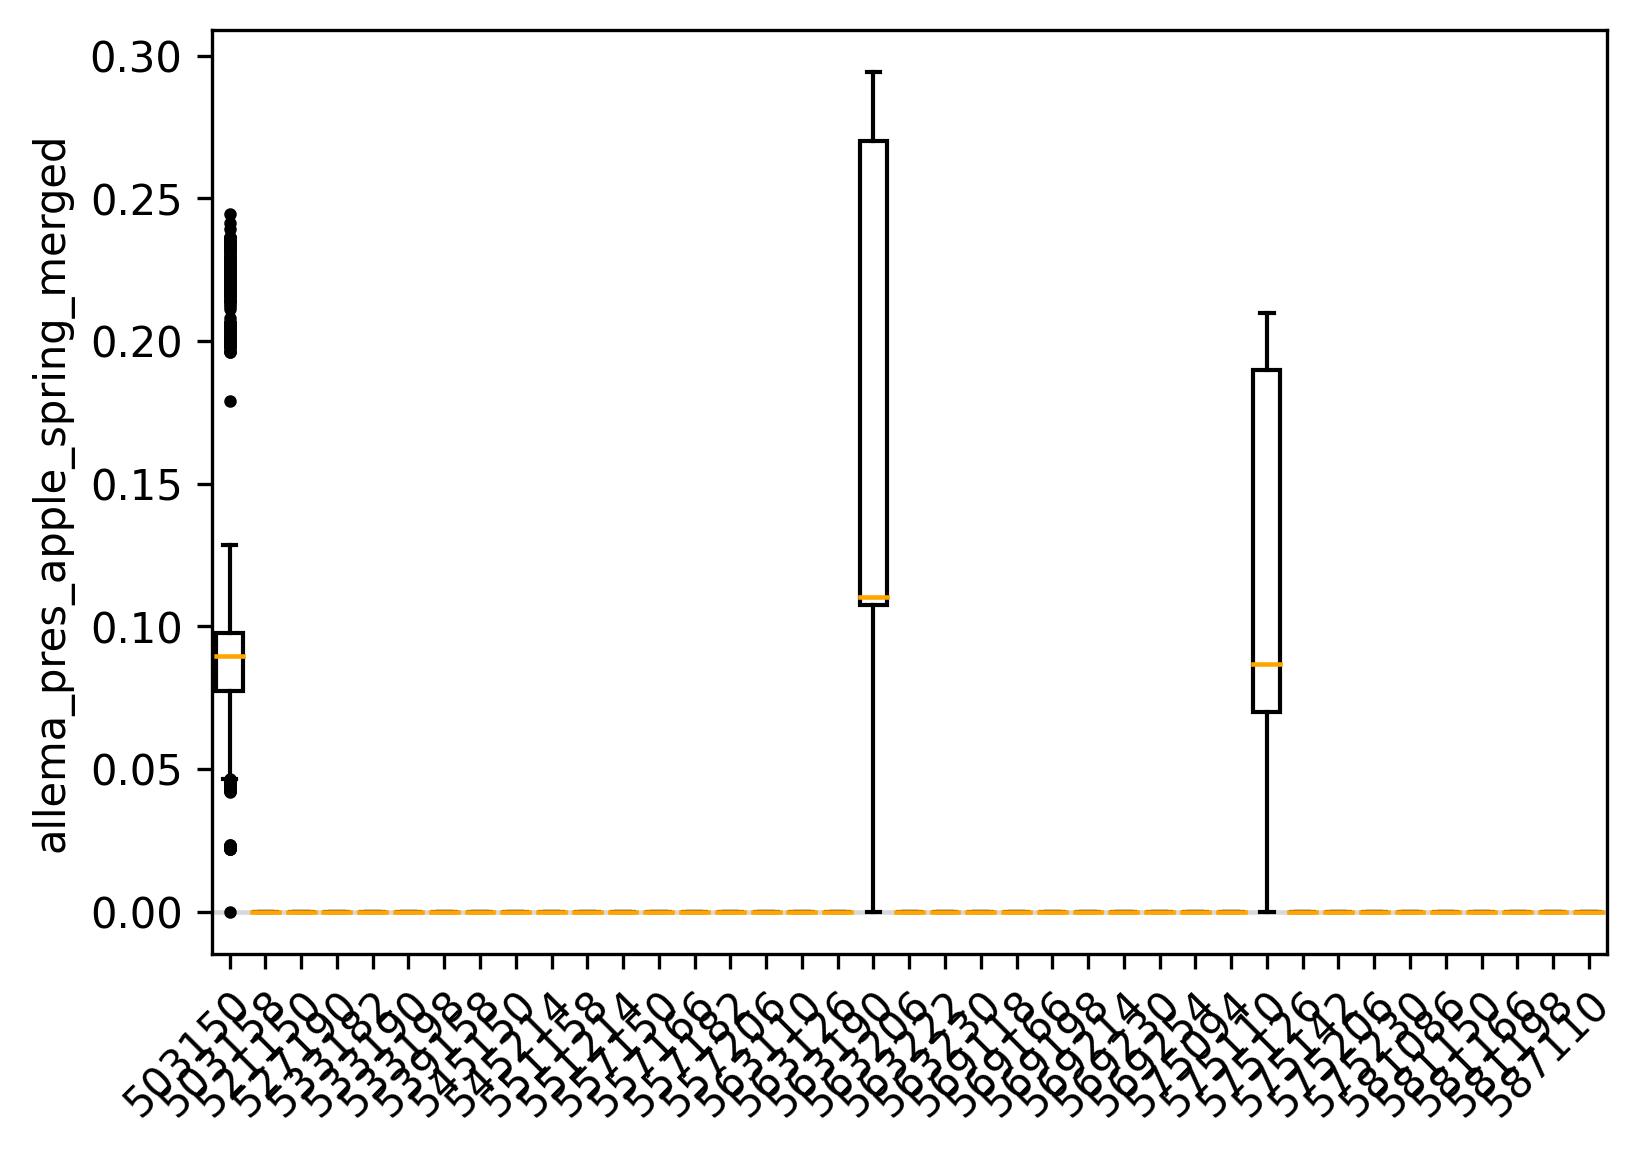
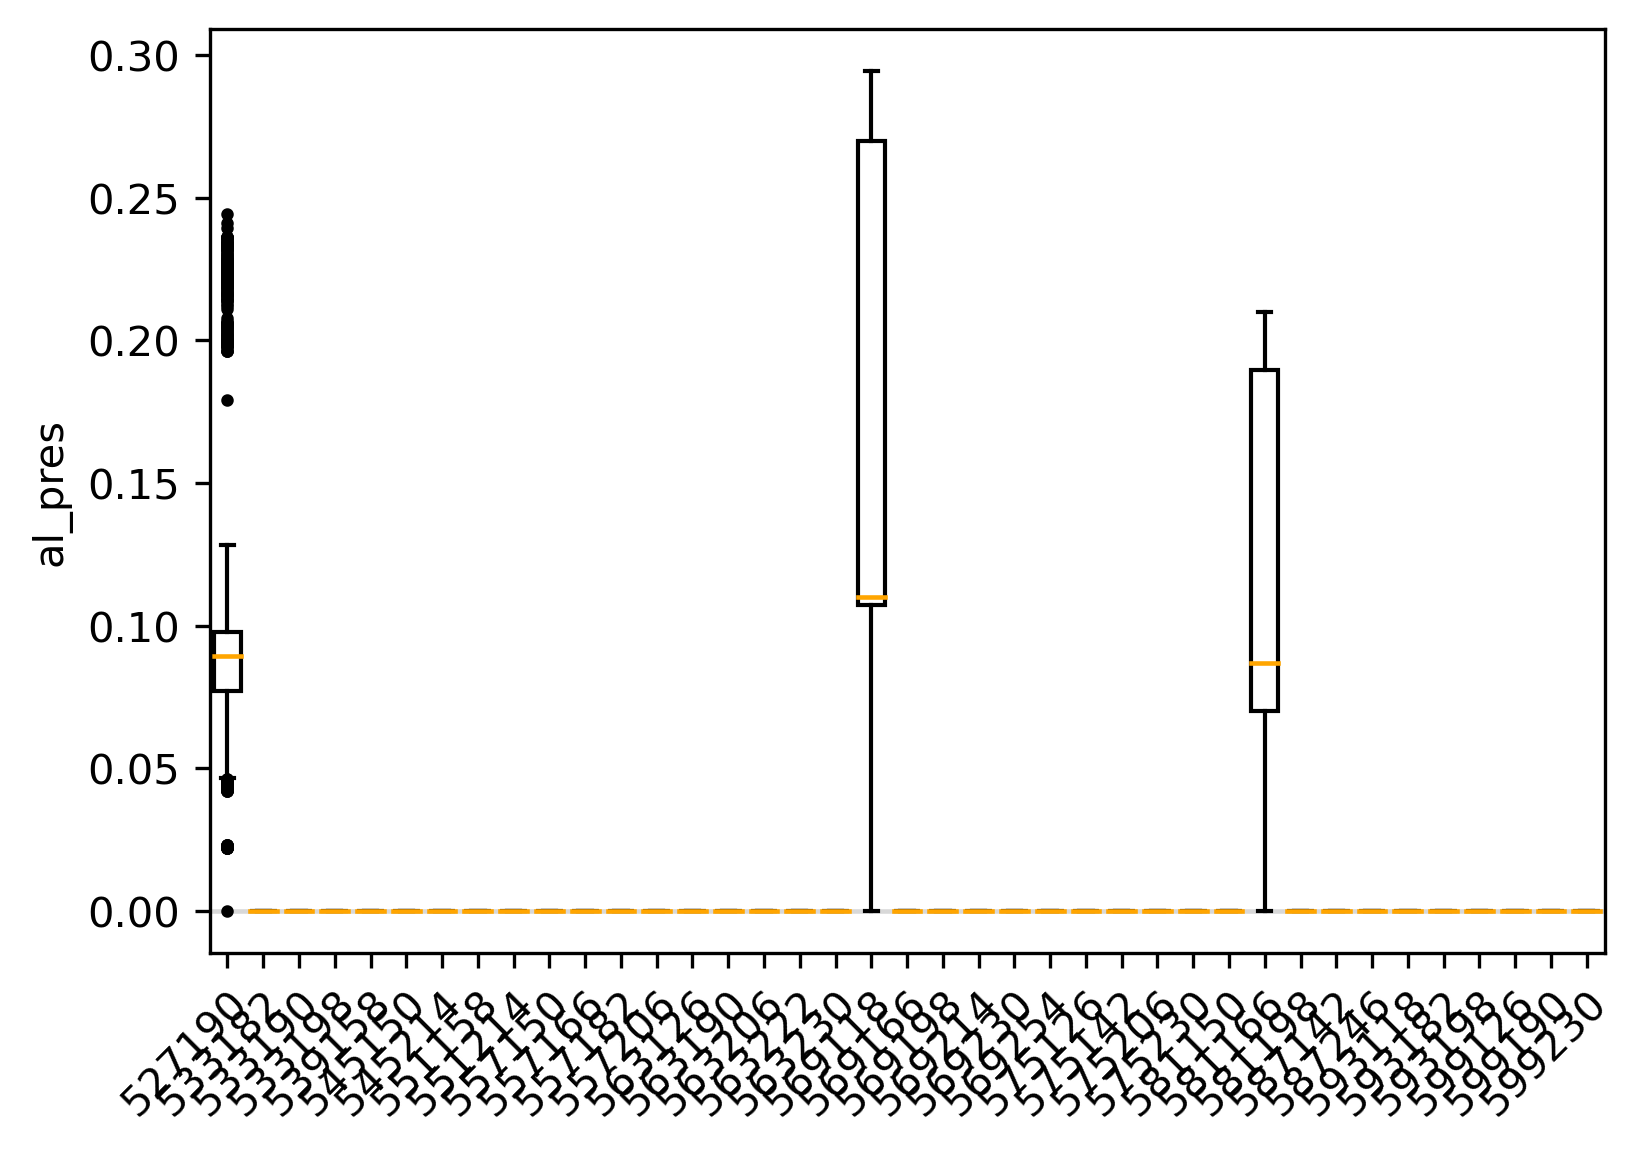
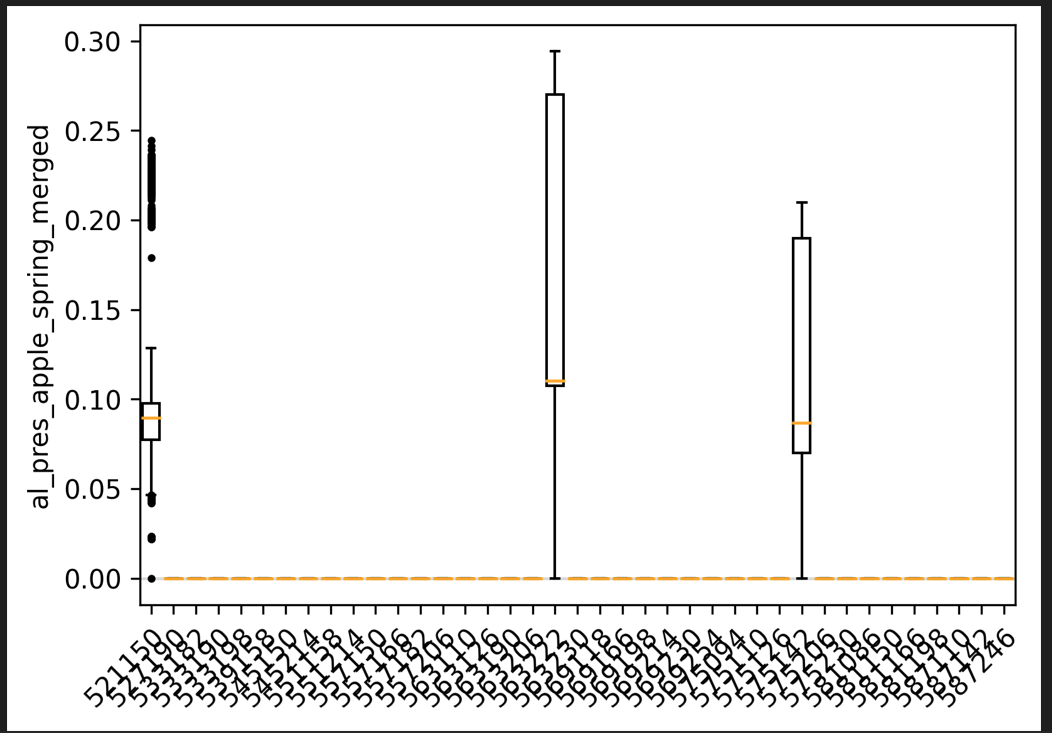
Here, below, are the steps I tried. At the start I would point out that the raster “al_pres_apple_spring_merged.tif” has very low variance, with almost all cells at value 0. When you make of boxplot of these values, you get a very narrow band near to the median value, very near to zero. Maybe that’s what is causing the confusion.
Create new GRASS location/mapset based on geotiff
grass -c al_pres_apple_spring_merged.tif ./CH1903+LV95
Now in that location Import both layers
$ r.import input=al_pres_apple_spring_merged.tif output=al_pres
$ g.region -ap rast=al_pres
projection: 99 (CH1903+ / LV95)
zone: 0
datum: ch1903
ellipsoid: bessel
north: 1270975
south: 1118025
west: 2527000
east: 2804000
nsres: 25
ewres: 25
rows: 6118
cols: 11080
cells: 67787440
Create raster for zones, all quadrats with the same value
$ v.to.rast input=quadrat output=quadrat use=val value=1
Prepare boxplot, I add the ‘-o’ flag to also plot outliers
$ r.boxplot -o input=al_pres zones=quadrat output=“al_pres_boxplot.png” raster_statistics=median
Have a look at the attached plot.
Now I check the univariate statistics of the al_pres raster:
al_pres univariate statistics
$ r.univar al_pres
100%
total null and non-null cells: 67787440
total null cells: 0
Of the non-null cells:
n: 67787440
minimum: 0
maximum: 0.315331
range: 0.315331
mean: 3.23424e-05
mean of absolute values: 3.23424e-05
standard deviation: 0.0022431
variance: 5.03148e-06
variation coefficient: 6935.47 %
sum: 2192.40546066407
Note that the variance is quite small. No wonder that the boxplot shows the median as a very narrow band almost at value zero.
Again, if I’m missing something, let me know.
On 03/06/2024 13:55, sibylle.stoeckli@gmx.ch wrote:
Dear Micha
Dear community
Find enclosed the two files necessary to run the code:
- The raster file to plot boxplots: al_pres_apple_spring_merged.tif
- The vector/shape file for the different quares (classes, regions…):Untersuchungsquadrate_2020-2024_shp
https://drive.google.com/drive/folders/14UwptmBQTtKYQFGeecRWa0n_lWDhRc9s?usp=sharing
Code based on
https://ecodiv.earth/post/drawing-boxplots-of-raster-values/
g.region -a vector=Untersuchungsquadrate_2020_2024
raster= al_pres_apple_spring_merged.tif
r.mask vector=Untersuchungsquadrate_2020_2024
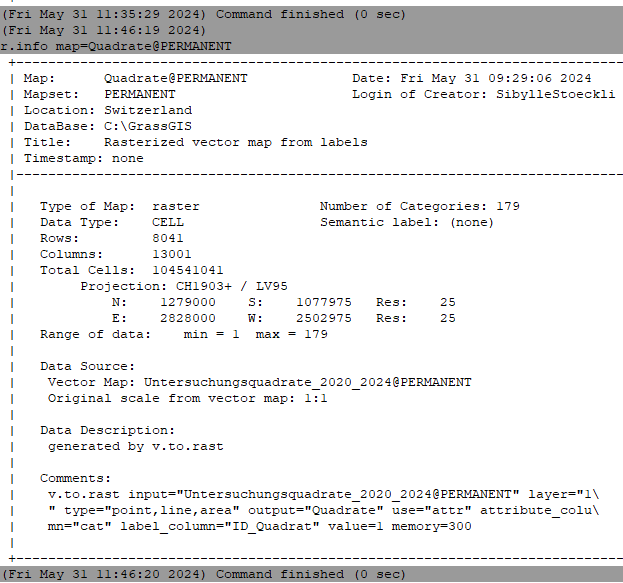
v.to.rast input=Untersuchungsquadrate_2020_2024@PERMANENT output=Quadrate use=attr attribute_column=“ID_Quadrat” label_column=“ID_Quadrat”
à Here is the identified challenge: transformation form “Untersuchungsquadrate” to “Quadrate” (as input for r.boxplot). attribute_column ID_Quadrat or cat provide false assignment. It just takes Number 1 (either cat or ID_Quadrat.
r.boxplot -o input=al_pres_apple_spring_merged.tif zones=Quadrate bx_sort=ascending raster_statistics=median
Kind regards
Sibylle
From: sibylle.stoeckli@gmx.ch sibylle.stoeckli@gmx.ch
Sent: Friday, May 31, 2024 12:10 PM
To: ‘Micha Silver’ tsvibar@gmail.com; ‘grass-user@lists.osgeo.org’ grass-user@lists.osgeo.org
Subject: RE: [GRASS-user] raster boxplots wrong assignment
Yes: see line 3
From: Micha Silver <tsvibar@gmail.com>
Sent: Friday, May 31, 2024 12:06 PM
To: sibylle.stoeckli@gmx.ch; grass-user@lists.osgeo.org
Subject: Re: [GRASS-user] raster boxplots wrong assignment
On 31/05/2024 12:48, sibylle.stoeckli@gmx.ch wrote:
Dear Micha
Thanks a lot interesting idea: Unfortunately I got a parse error. However the error/challenge is bevore selecting a specific region or site. I was able to plot one boxplot using a different code.
The challenge is that I use this code here to make “Quadrate/Squares” out of the vector layer “Untersuchungsquadrate”, because in r.boxplot you have input raster and zonal raster. Exactly in this code you make the assignment by defining attribute_column. I used both cat and ID_Quadrate, but it seems that my rasterized file “Quadrate” is not yet the one I need.
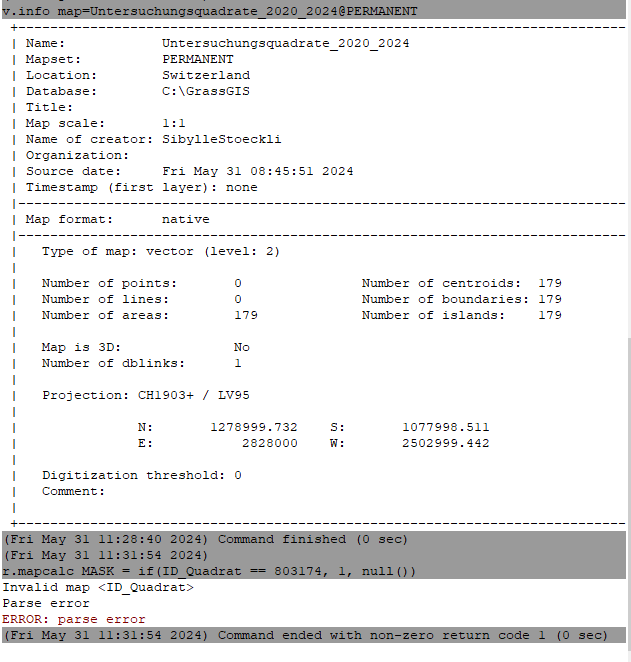
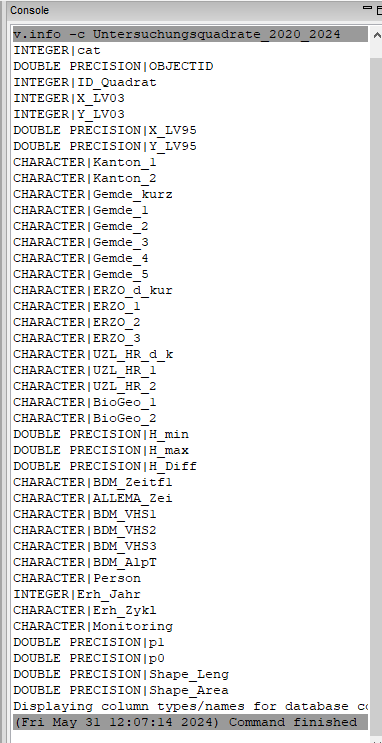
Can you post the output of: v.info -c Untersuchungsquadrate_2020_2024 ? (Just to verify the ID_Quadrate column)
Ecodiv.earth - Boxplots based on raster data in GRASS GIS
v.to.rast input=Untersuchungsquadrate_2020_2024@PERMANENT output=Quadrate use=attr attribute_column=cat label_column=“ID_Quadrat”
OK, after this command you should have a new raster “Quadrate” with pixel values taken from the cat values of the vector. (Why cat and not the ID_Quadrate?)
In the r.mapcalc expression:
1- The full expression needs to be in double quotes,
2- You need to use an existing raster map. Not the vector attribute values.
i.e.
r.mapcalc “MASK = if(Quadrate == 803174), 1, NULL())”
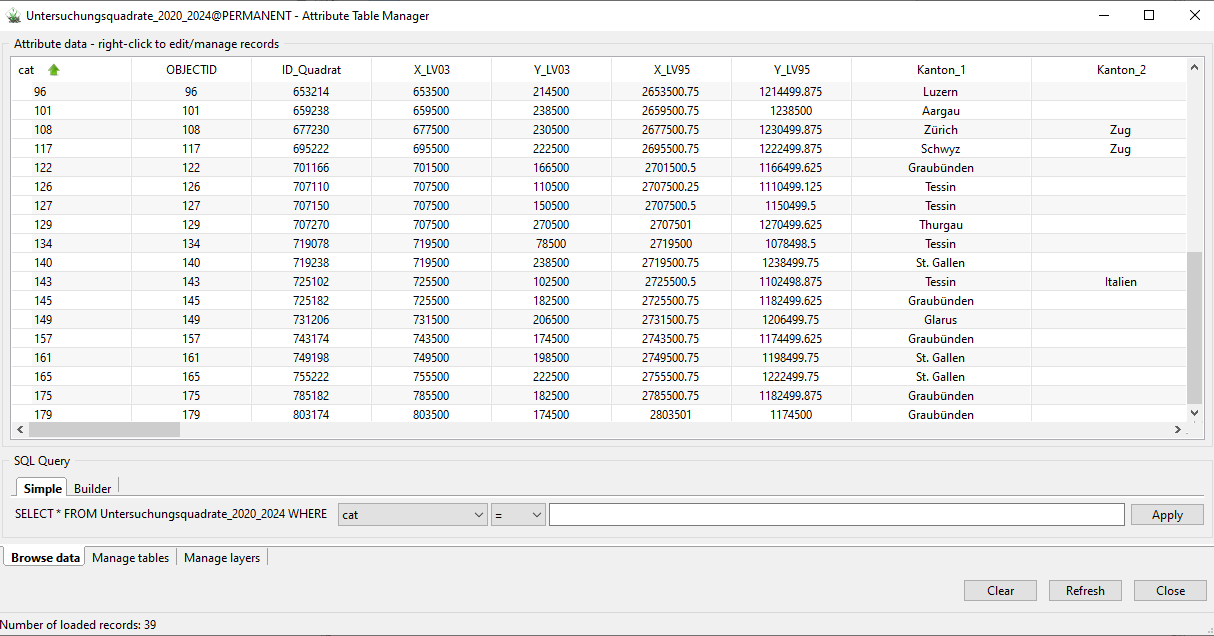
But, as you can see below (since you used the Untersuchungsquadrate_2020_2024 cat values (instead of the ID_Quadrate attrib), the raster values vary from 1 to 179. No value 803174…
I’d suggest to go back to using ID_Quadrate as attribute_column in your v.to.rast . Then try the r.mapcalc expression to get the mask defined. (Don’t forget to remove the mask after: r.mask -r)
HTH
From: Micha Silver tsvibar@gmail.com
Sent: Friday, May 31, 2024 11:09 AM
To: sibylle.stoeckli@gmx.ch; grass-user@lists.osgeo.org
Subject: Re: [GRASS-user] raster boxplots wrong assignment
Hi Sibylle:
I’m not sure I fully understand the problem. If the below example is not relevant, just ignore…
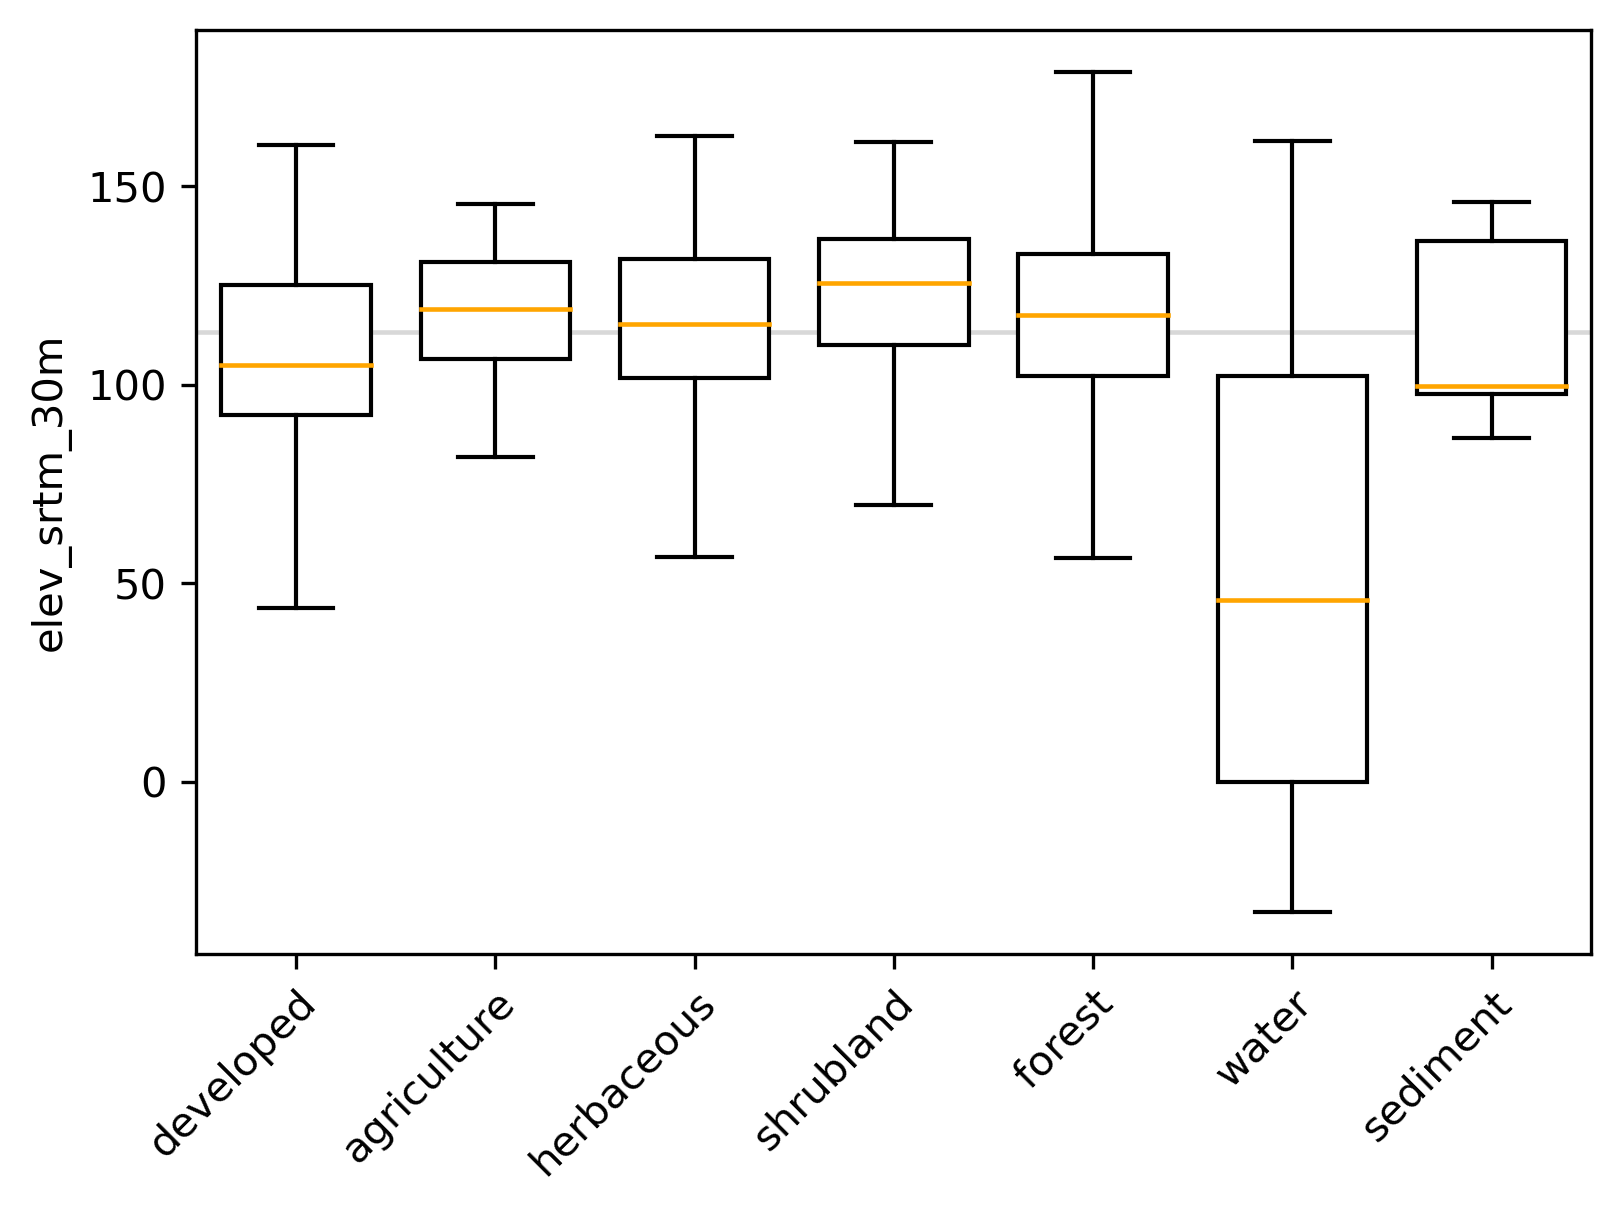
I did a simple test using the nc_spm_08 location. The PERMANENT mapset includes an elevation raster ‘elev_srtm_30m’ and a categorical landcover raster ‘landclass96’. I used the landcover raster as zones, and elevation for the values in the boxplots.
g.region -ap rast=elev_srtm_30m
All landcover zones
r.boxplot input=elev_srtm_30m zones=landclass96 raster_statistics=median output=~/work/tmp/boxplot.png --o
See attached boxplot image
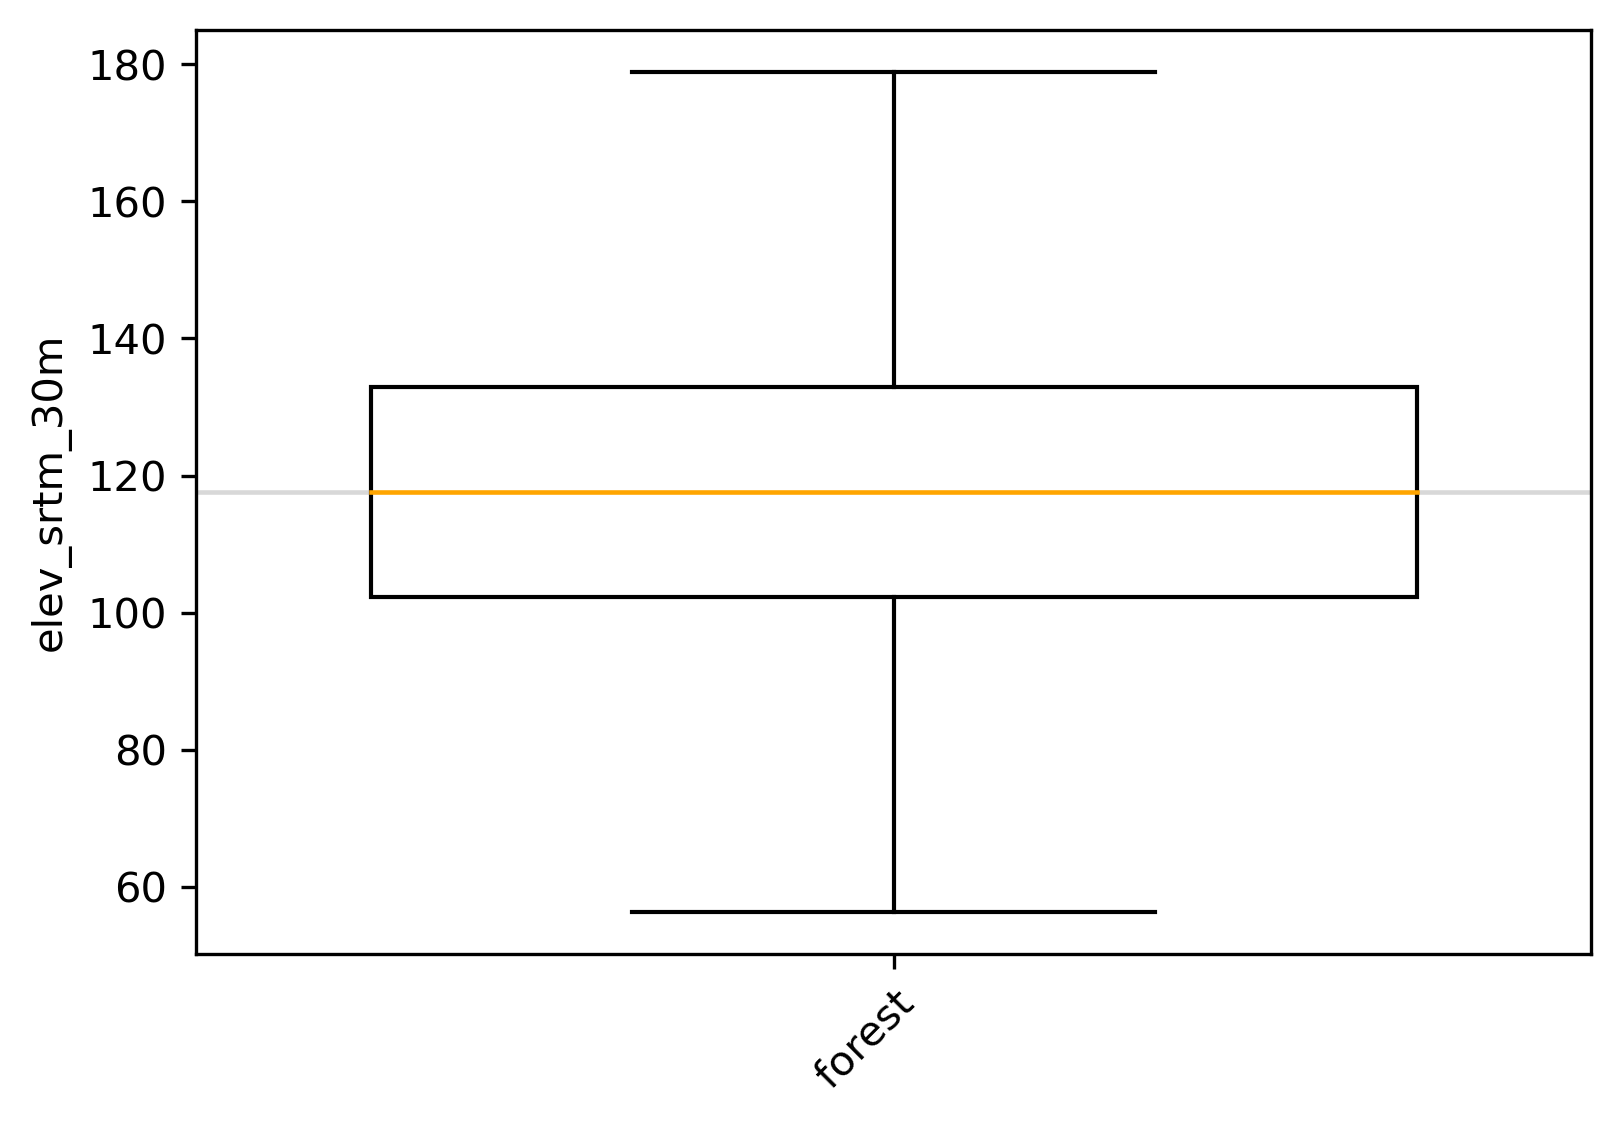
Now limit to only one zone, the forests, class 5 in this raster:
r.mapcalc “MASK = if(landclass96 == 5, 1, null())”
r.boxplot input=elev_srtm_30m zones=landclass96 raster_statistics=median output=~/work/tmp/boxplot_forest.png
See attached boxplot_forest
r.mask -r
Hope this is somehow helpful.
On 31/05/2024 10:35, sibylle via grass-user wrote:
Dear community
I tested the r.boxplot addon and it is definitively possible to run the addon with more than 20 classes/regions/sites/squares.
Furthermore I realised the reason for the wrong assignment of class to raster, but I am not yet able to fix it.
- The challenge is, that (at the moment) I have raster data for one class (one square), but in total I have 150 squares. So at the moment it just selects the first square (either by cat oder ID_Quadrat).
- It seems however, if I have raster data for all squares, r.boxplot is working fine.
- My question: Is it possible to assign raster data for one individual class/squares, of you have missing data for other classes/squares?
Kind regards
Sibylle
First using this code here:
v.to.rast input=Untersuchungsquadrate_2020_2024@PERMANENT output=Quadrate use=attr attribute_column=“ID_Quadrat” label_column=“ID_Quadrat”
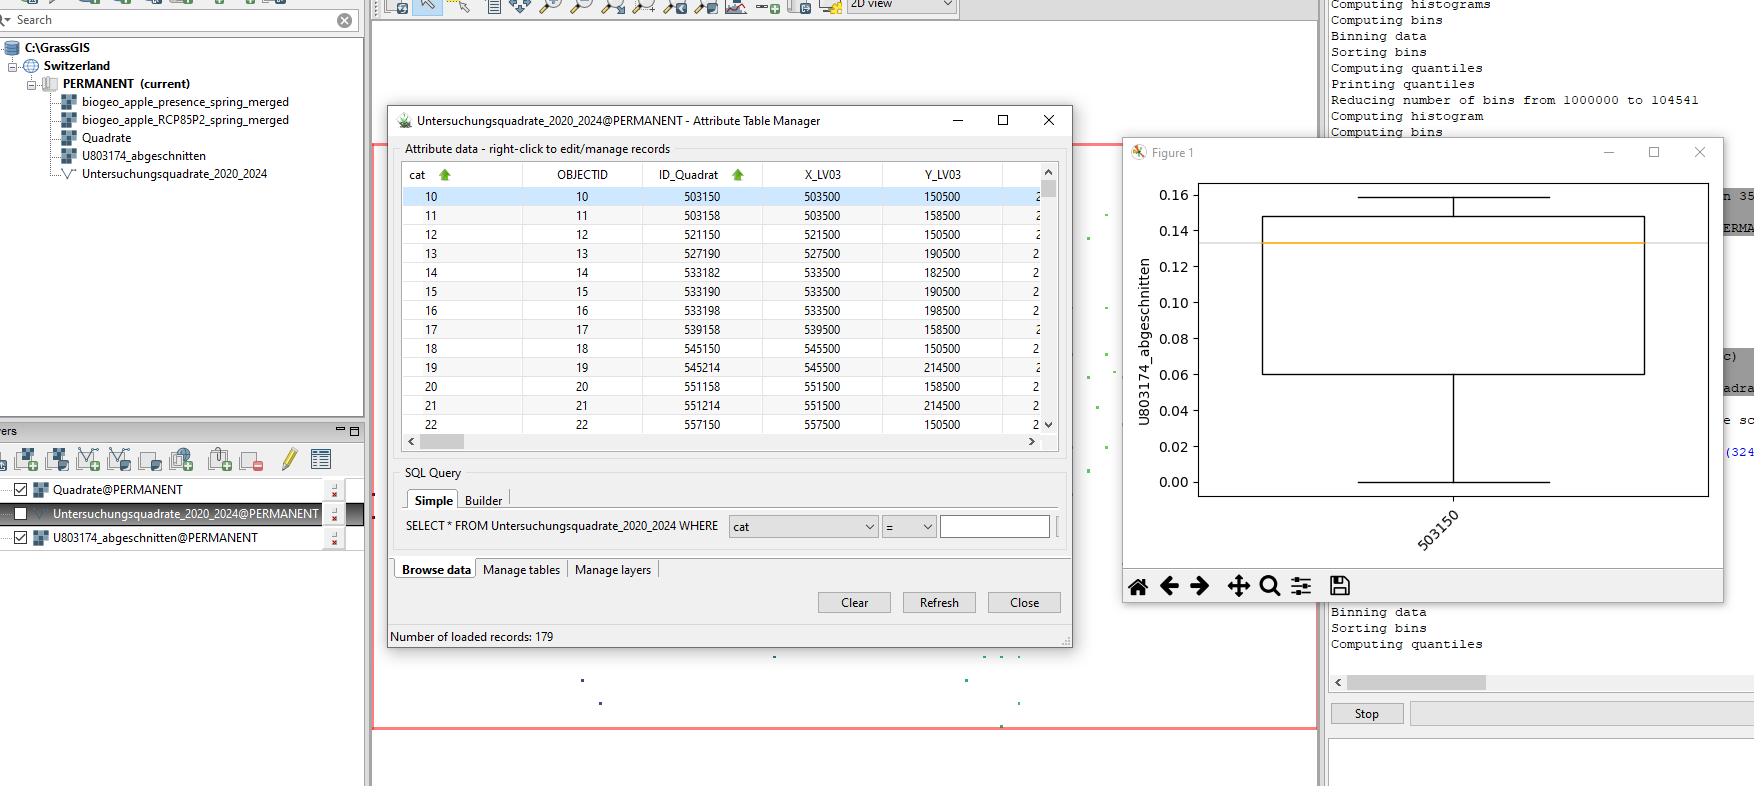
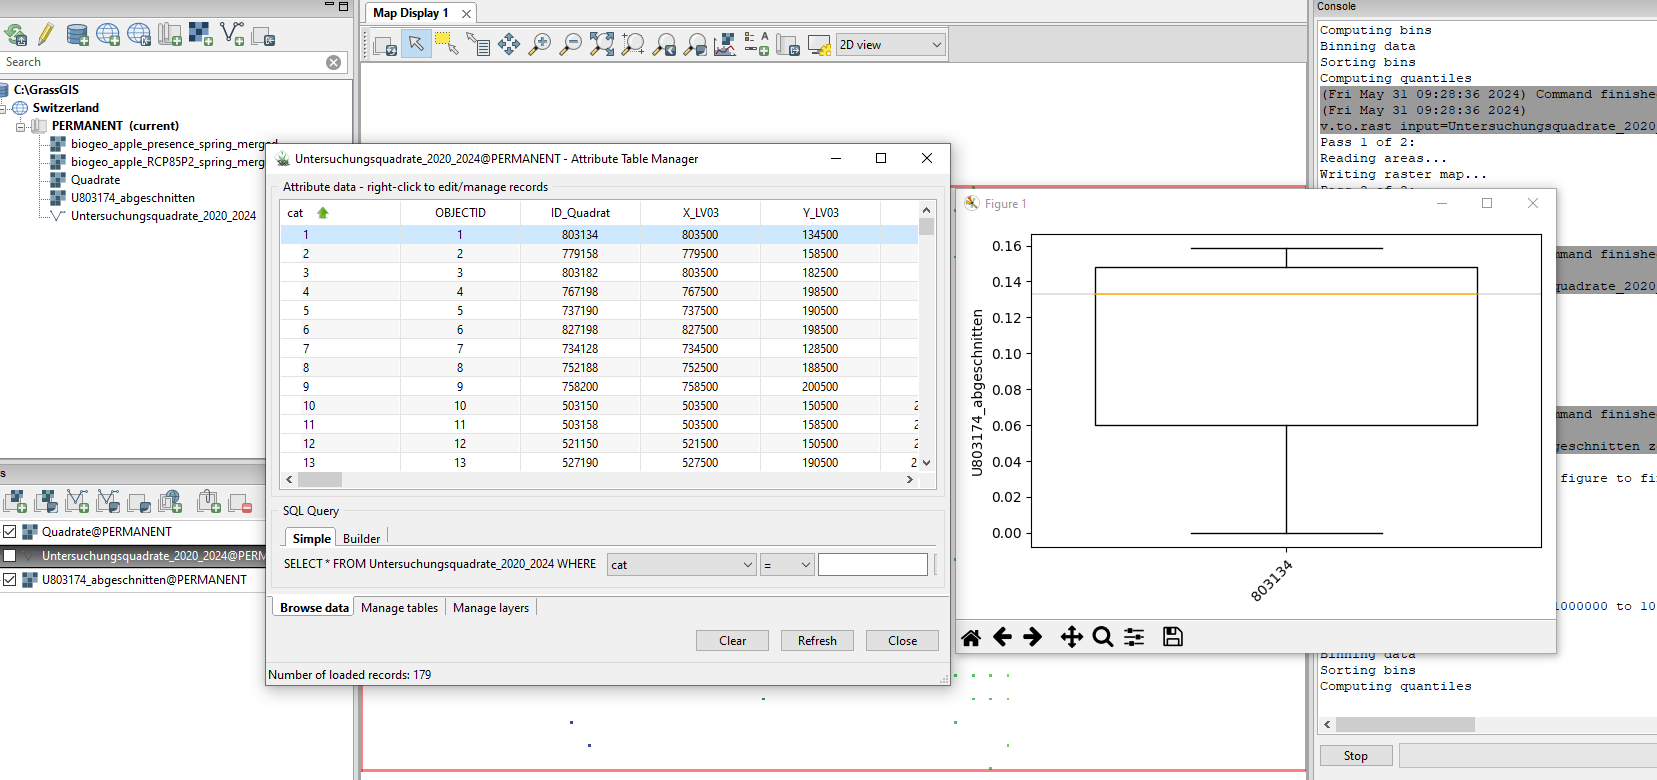
r.boxplot -o input=U803174_abgeschnitten zones=Quadrate bx_sort=ascending raster_statistics=median
Second using this code here:
v.to.rast input=Untersuchungsquadrate_2020_2024@PERMANENT output=Quadrate use=attr attribute_column=cat label_column=“ID_Quadrat”
r.boxplot -o input=U803174_abgeschnitten zones=Quadrate bx_sort=ascending raster_statistics=median
From: sibylle.stoeckli@gmx.ch sibylle.stoeckli@gmx.ch
Sent: Thursday, May 30, 2024 9:27 AM
To: ‘grass-user@lists.osgeo.org’ grass-user@lists.osgeo.org
Subject: RE: raster boxplots wrong assignment
Dear community
I am still wondering, if the r.boxplot addon is working with just a limited number of areass/sites/regions?
Kind regards
Sibylle
From: sibylle.stoeckli@gmx.ch <sibylle.stoeckli@gmx.ch>
Sent: Saturday, May 25, 2024 3:48 PM
To: ‘grass-user@lists.osgeo.org’ <grass-user@lists.osgeo.org>
Subject: raster boxplots wrong assignment
Dear community
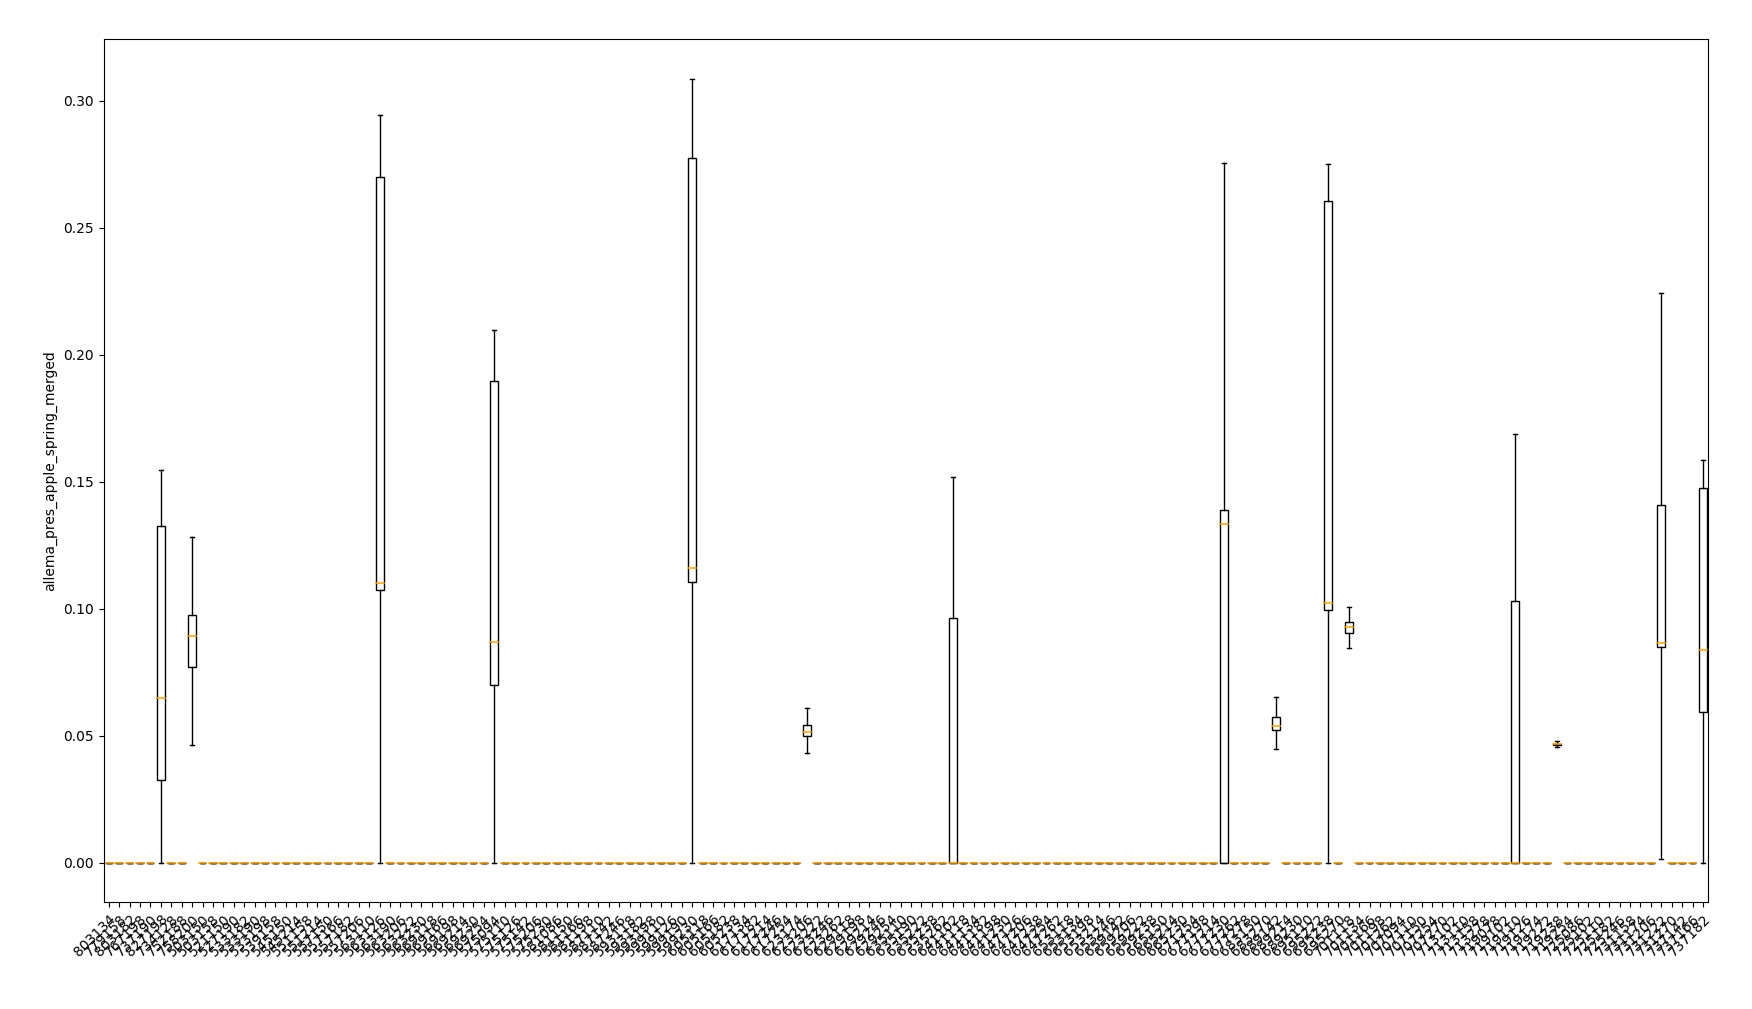
I would like to plot boxplots from a raster _pres_apple_spring_merged for different 1 km2 squares (38 squares, Fig. 1, layer “Untersuchungsquadrate”). I was using the same code as used before for 12 regions:
https://ecodiv.earth/post/drawing-boxplots-of-raster-values/ (Author Paulo van Breugel). All layers have the same projection (EPSG:2056, CH1903+/LV95). However, when loading the layer squares (Untersuchungsquadrate) GRASS GIS was asking for reprojection.
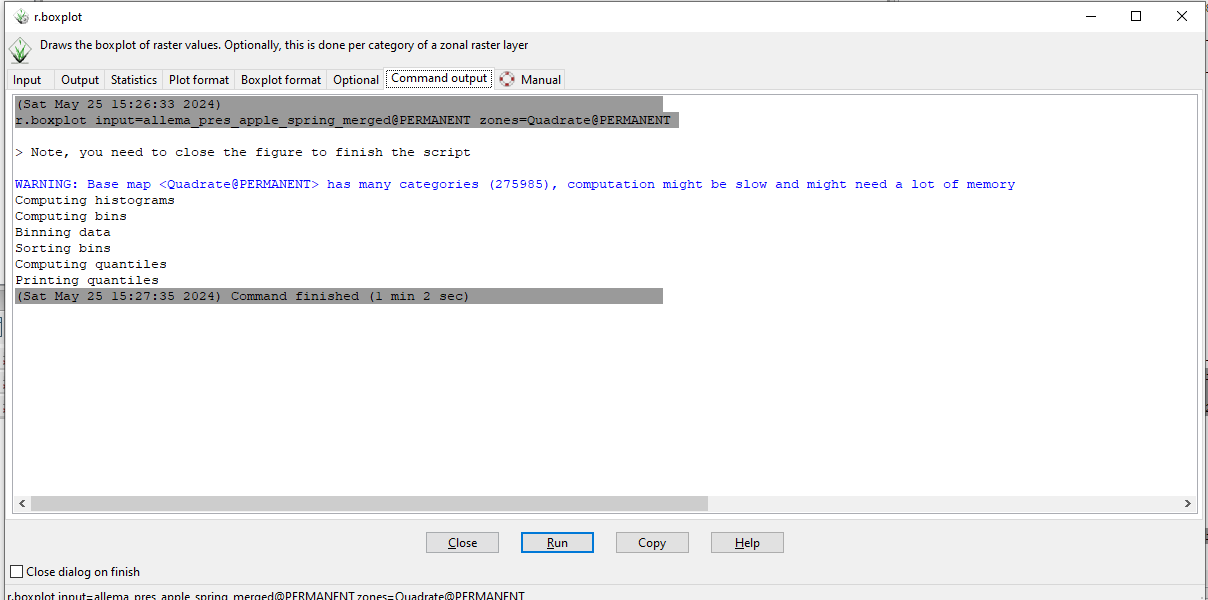
- I got now a warning message, that I have a lot of categories, however, the modelling time was fast (Fig 2)
- The error is now, that the boxplot is not showing all squares (e.g. ID_Quadrat 803174) and the boxplots are assigned to the wrong square (ID_Quadrat) (Fig. 3)
Kind regards
Sibylle Stöckli
Fig. 1
Fig. 2
Figure 3
_______________________________________________
grass-user mailing list
[grass-user@lists.osgeo.org](mailto:grass-user@lists.osgeo.org)
[https://lists.osgeo.org/mailman/listinfo/grass-user](https://lists.osgeo.org/mailman/listinfo/grass-user)
--
Micha Silver
Ben Gurion Univ.
Sde Boker, Remote Sensing Lab
cell: +972-523-665918
--
Micha Silver
Ben Gurion Univ.
Sde Boker, Remote Sensing Lab
cell: +972-523-665918
--
Micha Silver
Ben Gurion Univ.
Sde Boker, Remote Sensing Lab
cell: +972-523-665918