Hi,
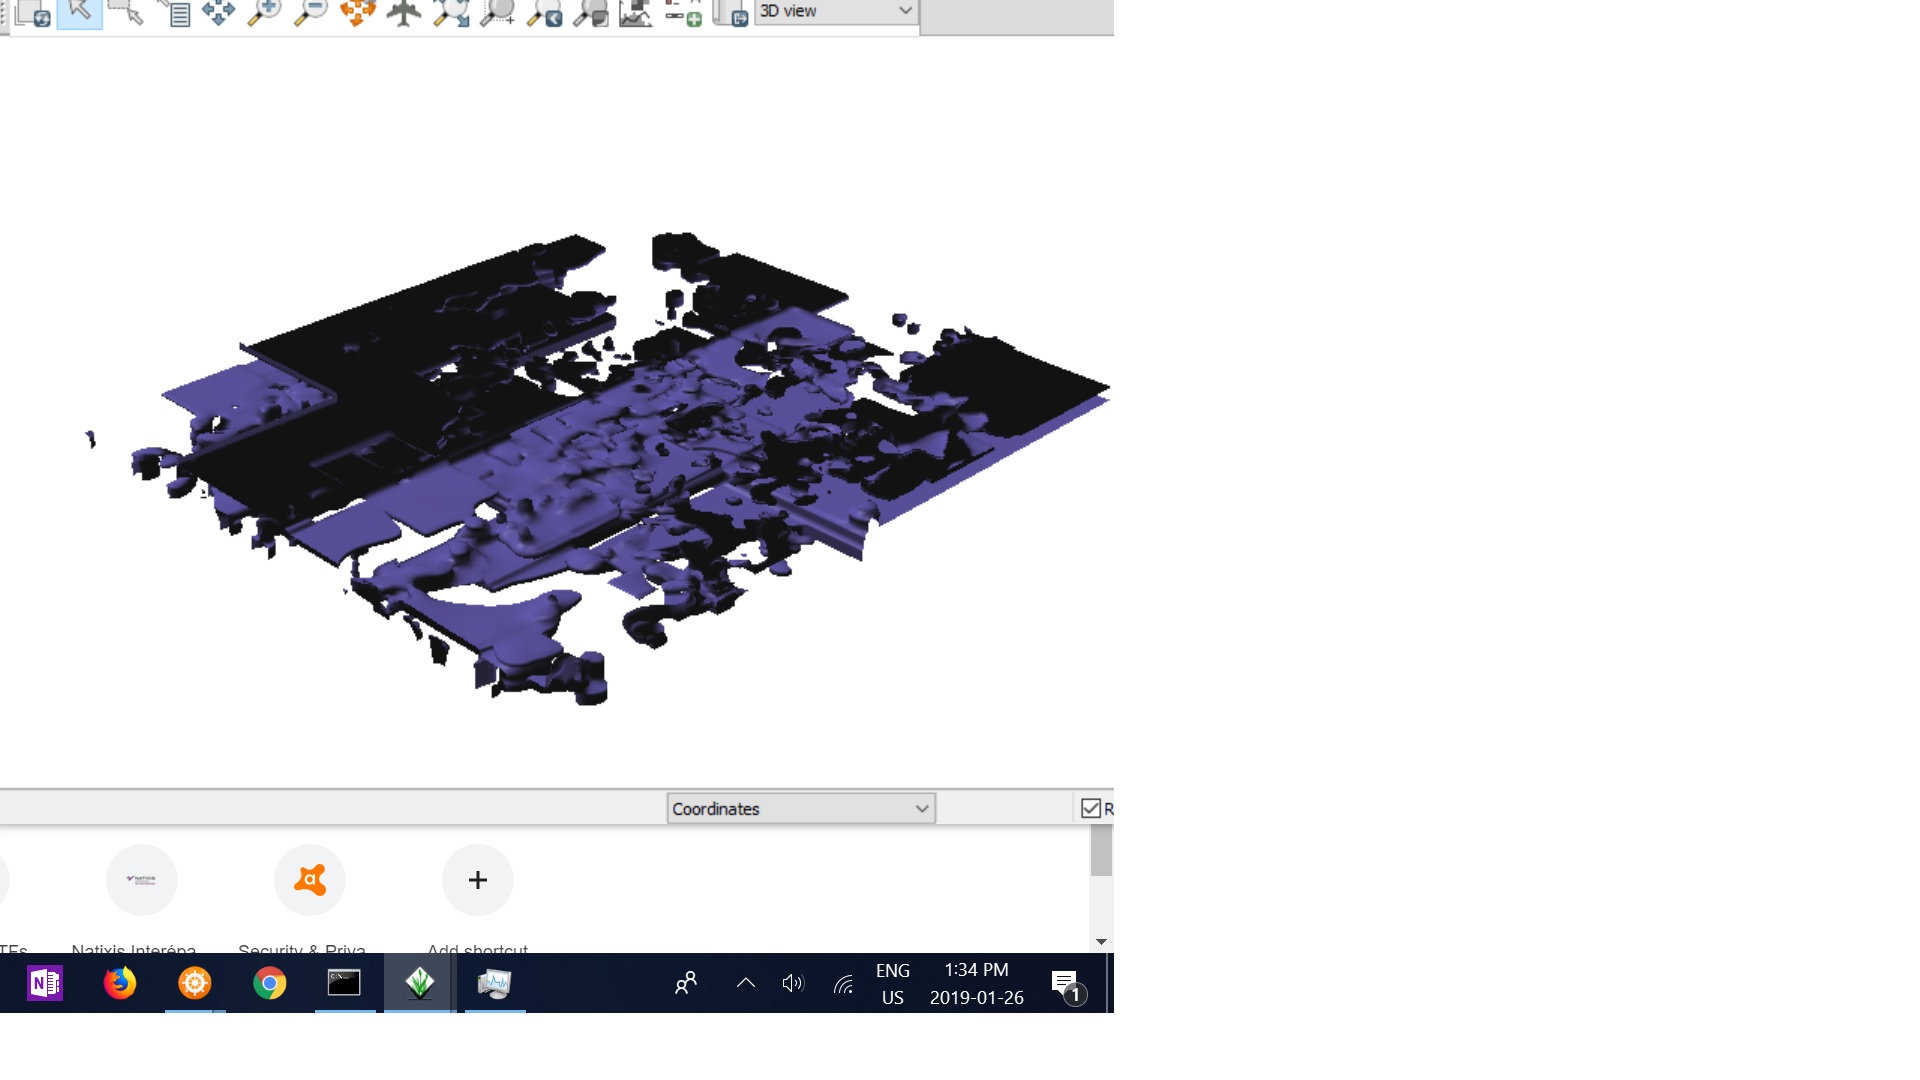
Using v.vol.rst, (see command below, and g.region), the interpolation results in rectangular areas in certain areas, see attached photo.
Does this have to do with the segmentation process or something else?
v.vol.rst --overwrite input=“Dec16CleanedJjan12@Toronto” wcolumn=“db\ |
| l_2” tension=10 smooth=0.1 segmax=50 npmin=200 npmax=700 dmin=0.1 ws\ |
| cale=1.0 zscale=1.0 elevation=“jan25”
(Sat Jan 26 13:37:21 2019) Command finished (0 sec)
(Sat Jan 26 13:37:44 2019)
r3.info map=Jan25@Toronto
±---------------------------------------------------------------------------+
| Layer: Jan25@Toronto Date: Fri Jan 25 22:12:59 2019 |
| Mapset: Toronto Login of Creator: Francois Charti |
| Location: Toronto |
| DataBase: C:\Users\Francois Chartier\Documents\grassdata |
| Title: jan25 |
| Units: none |
| Vertical unit: units |
| Timestamp: none |
|
| Type of Map: raster_3d Number of Categories: 0 |
| Data Type: FCELL |
| Rows: 400 |
| Columns: 450 |
| Depths: 65 |
| Total Cells: 11700000 |
| Total size: 27646661 Bytes |
| Number of tiles: 1575 |
| Mean tile size: 17553 Bytes |
| Tile size in memory: 32400 Bytes |
| Number of tiles in x, y and z: 15, 15, 7 |
| Dimension of a tile in x, y, z: 30, 27, 10 |
|
| Projection: UTM (zone 17) |
| N: 4837000 S: 4833000 Res: 10 |
| E: 632500 W: 628000 Res: 10 |
| T: 115 B: 50 Res: 1 |
| Range of data: min = -25.42733002 max = 121.86579132 |
|
| Data Source: |
|
|
|
| Data Description: |
| generated by v.vol.rst |
|
| Comments: |
| v.vol.rst --overwrite input=“Dec16CleanedJjan12@Toronto” wcolumn="db\ |
| l_2" tension=10 smooth=0.1 segmax=50 npmin=200 npmax=700 dmin=0.1 ws\ |
| cale=1.0 zscale=1.0 elevation=“jan25” |
|
| ±---------------------------------------------------------------------------+ |
| (Sat Jan 26 13:37:45 2019) Command finished (0 sec) |
C:\Users\Francois Chartier>g.region -p3
projection: 1 (UTM)
zone: 17
datum: nad83
ellipsoid: grs80
north: 4837000
south: 4833000
west: 628000
east: 632500
top: 115.00000000
bottom: 50.00000000
nsres: 10
nsres3: 10
ewres: 10
ewres3: 10
tbres: 1
rows: 400
rows3: 400
cols: 450
cols3: 450
depths: 65
cells: 180000
cells3: 11700000
C:\Users\Francois Chartier>
(attachments)
On Sat, Jan 26, 2019 at 7:43 PM Francois Chartier <fra.chartier@gmail.com> wrote:
Hi,
Using v.vol.rst, (see command below, and g.region), the interpolation results in rectangular areas in certain areas, see attached photo.
Does this have to do with the segmentation process or something else?
Most probably yes, try to increase npmin. Maybe you also need to increase segmax, but segmax should not be increased without increasing npmin, otherwise you might get more of these block artefacts.
Markus M
v.vol.rst --overwrite input=“Dec16CleanedJjan12@Toronto” wcolumn=“db\ |
| l_2” tension=10 smooth=0.1 segmax=50 npmin=200 npmax=700 dmin=0.1 ws\ |
| cale=1.0 zscale=1.0 elevation=“jan25”
(Sat Jan 26 13:37:21 2019) Command finished (0 sec)
(Sat Jan 26 13:37:44 2019)
r3.info map=Jan25@Toronto
±---------------------------------------------------------------------------+
| Layer: Jan25@Toronto Date: Fri Jan 25 22:12:59 2019 |
| Mapset: Toronto Login of Creator: Francois Charti |
| Location: Toronto |
| DataBase: C:\Users\Francois Chartier\Documents\grassdata |
| Title: jan25 |
| Units: none |
| Vertical unit: units |
| Timestamp: none |
|
| Type of Map: raster_3d Number of Categories: 0 |
| Data Type: FCELL |
| Rows: 400 |
| Columns: 450 |
| Depths: 65 |
| Total Cells: 11700000 |
| Total size: 27646661 Bytes |
| Number of tiles: 1575 |
| Mean tile size: 17553 Bytes |
| Tile size in memory: 32400 Bytes |
| Number of tiles in x, y and z: 15, 15, 7 |
| Dimension of a tile in x, y, z: 30, 27, 10 |
|
| Projection: UTM (zone 17) |
| N: 4837000 S: 4833000 Res: 10 |
| E: 632500 W: 628000 Res: 10 |
| T: 115 B: 50 Res: 1 |
| Range of data: min = -25.42733002 max = 121.86579132 |
|
| Data Source: |
|
|
|
| Data Description: |
| generated by v.vol.rst |
|
| Comments: |
| v.vol.rst --overwrite input=“Dec16CleanedJjan12@Toronto” wcolumn="db\ |
| l_2" tension=10 smooth=0.1 segmax=50 npmin=200 npmax=700 dmin=0.1 ws\ |
| cale=1.0 zscale=1.0 elevation=“jan25” |
|
| ±---------------------------------------------------------------------------+ |
| (Sat Jan 26 13:37:45 2019) Command finished (0 sec) |
C:\Users\Francois Chartier>g.region -p3
projection: 1 (UTM)
zone: 17
datum: nad83
ellipsoid: grs80
north: 4837000
south: 4833000
west: 628000
east: 632500
top: 115.00000000
bottom: 50.00000000
nsres: 10
nsres3: 10
ewres: 10
ewres3: 10
tbres: 1
rows: 400
rows3: 400
cols: 450
cols3: 450
depths: 65
cells: 180000
cells3: 11700000
C:\Users\Francois Chartier>
Virus-free. www.avast.com
grass-user mailing list
grass-user@lists.osgeo.org
https://lists.osgeo.org/mailman/listinfo/grass-user
i will do that. i think also as there is denilevation in that area, some of the voxels are above ground which creates these ‘empty’ areas.
On Thu, Jan 31, 2019, 02:25 Markus Metz <markus.metz.giswork@gmail.com wrote:
On Sat, Jan 26, 2019 at 7:43 PM Francois Chartier <fra.chartier@gmail.com> wrote:
Hi,
Using v.vol.rst, (see command below, and g.region), the interpolation results in rectangular areas in certain areas, see attached photo.
Does this have to do with the segmentation process or something else?
Most probably yes, try to increase npmin. Maybe you also need to increase segmax, but segmax should not be increased without increasing npmin, otherwise you might get more of these block artefacts.
Markus M
v.vol.rst --overwrite input=“Dec16CleanedJjan12@Toronto” wcolumn=“db\ |
| l_2” tension=10 smooth=0.1 segmax=50 npmin=200 npmax=700 dmin=0.1 ws\ |
| cale=1.0 zscale=1.0 elevation=“jan25”
(Sat Jan 26 13:37:21 2019) Command finished (0 sec)
(Sat Jan 26 13:37:44 2019)
r3.info map=Jan25@Toronto
±---------------------------------------------------------------------------+
| Layer: Jan25@Toronto Date: Fri Jan 25 22:12:59 2019 |
| Mapset: Toronto Login of Creator: Francois Charti |
| Location: Toronto |
| DataBase: C:\Users\Francois Chartier\Documents\grassdata |
| Title: jan25 |
| Units: none |
| Vertical unit: units |
| Timestamp: none |
|
| Type of Map: raster_3d Number of Categories: 0 |
| Data Type: FCELL |
| Rows: 400 |
| Columns: 450 |
| Depths: 65 |
| Total Cells: 11700000 |
| Total size: 27646661 Bytes |
| Number of tiles: 1575 |
| Mean tile size: 17553 Bytes |
| Tile size in memory: 32400 Bytes |
| Number of tiles in x, y and z: 15, 15, 7 |
| Dimension of a tile in x, y, z: 30, 27, 10 |
|
| Projection: UTM (zone 17) |
| N: 4837000 S: 4833000 Res: 10 |
| E: 632500 W: 628000 Res: 10 |
| T: 115 B: 50 Res: 1 |
| Range of data: min = -25.42733002 max = 121.86579132 |
|
| Data Source: |
|
|
|
| Data Description: |
| generated by v.vol.rst |
|
| Comments: |
| v.vol.rst --overwrite input=“Dec16CleanedJjan12@Toronto” wcolumn="db\ |
| l_2" tension=10 smooth=0.1 segmax=50 npmin=200 npmax=700 dmin=0.1 ws\ |
| cale=1.0 zscale=1.0 elevation=“jan25” |
|
| ±---------------------------------------------------------------------------+ |
| (Sat Jan 26 13:37:45 2019) Command finished (0 sec) |
C:\Users\Francois Chartier>g.region -p3
projection: 1 (UTM)
zone: 17
datum: nad83
ellipsoid: grs80
north: 4837000
south: 4833000
west: 628000
east: 632500
top: 115.00000000
bottom: 50.00000000
nsres: 10
nsres3: 10
ewres: 10
ewres3: 10
tbres: 1
rows: 400
rows3: 400
cols: 450
cols3: 450
depths: 65
cells: 180000
cells3: 11700000
C:\Users\Francois Chartier>
Virus-free. www.avast.com
grass-user mailing list
grass-user@lists.osgeo.org
https://lists.osgeo.org/mailman/listinfo/grass-user