Hello
I have an ascii file in .csv format containing x/y coordinates and z
values. Z column data represents geophysical data collected along
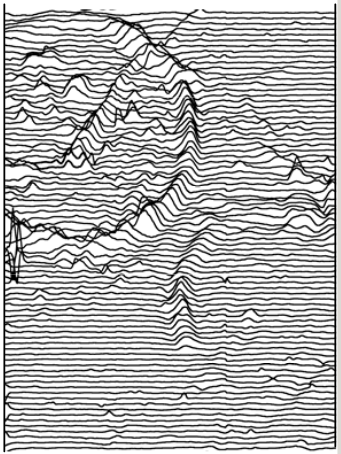
parallel lines (X and Y coordinates). I wish to display this data in a
format similar to an XY trace plot (see image example), where z data
recorded along individual traverses in the field can be displayed as a
raster image of parallel lines showing both negative and positive
responses along each line. So far I have imported small data sets using
both v.in.ascii and v.in.lines with also use of v.build.polylines but
the results only produce a single flat line. It is most likely I am not
going the right way about this, hence my query. I have searched the mail
archive in advance of this mail and found no relevant reference. Is it
possible to produce such a display with GRASS?
Thank you in advance,
John Nicholls.
(attachments)
Not sure it will work but maybe you will need to use some 3d view (nviz)?
Cheers
Daniel
On May 19, 2012 8:33 AM, “John Nicholls” <johnnicholls@fastmail.fm> wrote:
Hello
I have an ascii file in .csv format containing x/y coordinates and z
values. Z column data represents geophysical data collected along
parallel lines (X and Y coordinates). I wish to display this data in a
format similar to an XY trace plot (see image example), where z data
recorded along individual traverses in the field can be displayed as a
raster image of parallel lines showing both negative and positive
responses along each line. So far I have imported small data sets using
both v.in.ascii and v.in.lines with also use of v.build.polylines but
the results only produce a single flat line. It is most likely I am not
going the right way about this, hence my query. I have searched the mail
archive in advance of this mail and found no relevant reference. Is it
possible to produce such a display with GRASS?
Thank you in advance,
John Nicholls.
grass-user mailing list
grass-user@lists.osgeo.org
http://lists.osgeo.org/mailman/listinfo/grass-user
John wrote:
I have an ascii file in .csv format containing x/y coordinates and z
values. Z column data represents geophysical data collected along
parallel lines (X and Y coordinates). I wish to display this data in a
format similar to an XY trace plot (see image example), where z data
recorded along individual traverses in the field can be displayed as a
raster image of parallel lines showing both negative and positive
responses along each line. So far I have imported small data sets using
both v.in.ascii and v.in.lines with also use of v.build.polylines but
the results only produce a single flat line. It is most likely I am not
going the right way about this, hence my query. I have searched the mail
archive in advance of this mail and found no relevant reference. Is it
possible to produce such a display with GRASS?
the module has not been written yet, but you might try importing it with
r.in.xyz then interpolating with r.surf.nnbathy (addons) or one of the
other r.surf.* or v.surf.* modules.
maybe R has such a plotting tool already?
Hamish
ps- you might be interested in the v.in.p190 module from GRASS addons,
and the v.in.mbsys_fnv addon module which can read SEG-Y tracks via
MB-System. see http://grass.osgeo.org/wiki/Geophysics