Le Mon, 27 Feb 2017 09:41:11 +0100,
Leonardo <leonardo@mobygis.com> a écrit :
Thanks for your answer,
I had already thought of a solution of this type,
but I'm looking for a cleaner and smarter solution,
any hints?!
Well the "smarter" in your case would imply to use non-topological
vector format, which was decided for GRASS GIS to not be "smarter".
Yes, this makes some operations a bit more complicated, but you get
paid back with so much less hassle because of spaghetti data. And
writing a simple loop over v.rast.stats is not that difficult. The only
difficulty I see is that v.rast.stats does not have a where= nor cat=
feature selection parameter. This implies that you have to run
v.extract each time. Having these parameters would certainly be useful
and you could file an enhancement wish for those/
I don't know why this would be less "clean"...
The IMHO "cleanest" solution is actually the one that GRASS GIS
implements: When you import a file with overlapping polygons, GRASS GIS
creates a vector map in which the overlapping parts of the polygons
have the category ids of all the polygons that overlap in that area.
And when you run v.rast.stats on that, it will fill the total of each
category value in the attribute table.
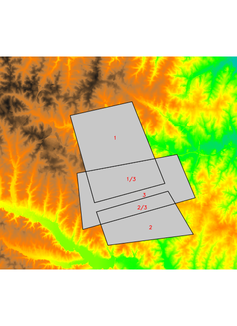
Attached you can find an image of a test map with polygon 3 overlapping
both polygon 1 and 2. I also created a second file with only the 2
non-overlapping polygons. Those two were created in QGIS so as to be
able to have "nice" topologically incorrect data.
I then imported the two files into GRASS GIS with v.in.ogr and ran
v.rast.stats map=test raster=elevation column_prefix=e
v.rast.stats map=test_nooverlap raster=elevation column_prefix=e
And here are the results:
v.db.select test
cat|id|e_number|e_minimum|e_maximum|e_range|e_average|e_stddev|e_variance|e_coeff_var|e_sum|e_first_quartile|e_median|e_third_quartile|e_percentile_90
1|1|242621|76.8941955566406|145.712738037109|68.8185424804688|114.397437714797|13.5650727983398|184.01120002426|11.8578467047128|27755220.7358017|104.996|115.337|124.654|131.38
2|2|131854|77.3364105224609|126.733070373535|49.3966598510742|99.4588066985328|10.6819214497898|114.103445859479|10.7400458585508|13114041.4984283|91.5773|98.7388|106.926|114.645
3|3|99039|71.4758224487305|139.941131591797|68.4653091430664|107.223648245541|13.7481896908839|189.012719776527|12.8219752972784|10619322.8985901|97.4993|105.891|118.752|126.703
v.db.select test_nooverlap
cat|id|e_number|e_minimum|e_maximum|e_range|e_average|e_stddev|e_variance|e_coeff_var|e_sum|e_first_quartile|e_median|e_third_quartile|e_percentile_90
1|1|242621|76.8941955566406|145.712738037109|68.8185424804688|114.397437714797|13.5650727983398|184.01120002426|11.8578467047128|27755220.7358017|104.996|115.337|124.654|131.38
2|2|131854|77.3364105224609|126.733070373535|49.3966598510742|99.4588066985328|10.6819214497898|114.103445859479|10.7400458585508|13114041.4984283|91.5773|98.7388|106.926|114.645
You can see that the values for polygons 1 and 2 are strictly
identical. Overlapping areas are thus correctly taken into account.
To test even further, I ran
v.extract -d test cat=3 out=test3
to get the entire polygon with cat=3.
Then
v.rast.stats test3 rast=elevation colprefix=e -c
v.db.select test3
cat|id|e_number|e_minimum|e_maximum|e_range|e_average|e_stddev|e_variance|e_coeff_var|e_sum|e_first_quartile|e_median|e_third_quartile|e_percentile_90
3|3|224074|71.4758224487305|141.793502807617|70.3176803588867|110.21428988784|13.2281044492473|174.982747320197|12.0021681968|24696156.7923279|100.265|110.004|120.916|127.836
There thus seems to be a bug in v.rast.stats as it does not calculate
the correct values for the polygon with cat=3 when there area polygons
with multiple cat values.
I'll post a bug report.
Moritz
(attachments)