Has anyone built a tool to assist in planning SWATH bathymetry surveys
in GRASS? Alternatively, do you know of a tool that would take
existing bathymetry as input and help me plan survey lines?
Thanks
--
David Finlayson
Has anyone built a tool to assist in planning SWATH bathymetry surveys
in GRASS? Alternatively, do you know of a tool that would take
existing bathymetry as input and help me plan survey lines?
Thanks
--
David Finlayson
Has anyone built a tool to assist in planning SWATH bathymetry surveys
in GRASS? Alternatively, do you know of a tool that would take
existing bathymetry as input and help me plan survey lines?
r.transect -g, r.profile -g
and make vector lines from result, then v.buffer?
That way might be fairly labor intensive without a script.
just use v.digit or QGIS digitization of lines over a DEM backdrop?
how much will depth vary? (as beam width & space between tracks will
increase with depth)
"v.mkgrid angle=" might be quite useful
Simrad setup or similar? digital out?
For old paper Sidescan Sonar recorders + GPS track the new thin plate
spline warping in gdalwarp has given me much better results than with
Caris GIS or ERDAS. A few bumps along the way but in the end a pretty
smooth process.
Someone made a good free (beer) data viewer for swath data.. can't
remember the name now ![]() I'll rereply if it comes to me.
I'll rereply if it comes to me.
Ocean Data View isn't really what you're after, but maybe useful:
http://odv.awi-bremerhaven.de/
Also check out Bob's Tekmap website. http://www.tekmap.ns.ca/
Hamish
David,
What water depths will you be working at? I ask because you can usually plan
parallel lines in deeper water where you don't have to contend with islands,
shoals, fishing gear, etc. We use Regulus software from ICAN as our nav
package for swath surveys, but all it really does is plot parallel lines of
a given length and angle orientation, (i.e. v.parallel, v.digit). For
non-parallel survey grids, we really just digitize arbitrary survey tracks.
I'm not sure if the MB-System has a survey grid making tool, maybe worth a
check:
http://www.ldeo.columbia.edu/res/pi/MB-System/
~ Eric.
-----Original Message-----
From: owner-GRASSLIST@baylor.edu
To: David Finlayson
Cc: GRASSLIST@baylor.edu
Sent: 4/19/2006 11:48 PM
Subject: [GRASSLIST:773] Re: Planning swath bathymetry surveys
Has anyone built a tool to assist in planning SWATH bathymetry surveys
in GRASS? Alternatively, do you know of a tool that would take
existing bathymetry as input and help me plan survey lines?
r.transect -g, r.profile -g
and make vector lines from result, then v.buffer?
That way might be fairly labor intensive without a script.
just use v.digit or QGIS digitization of lines over a DEM backdrop?
how much will depth vary? (as beam width & space between tracks will
increase with depth)
"v.mkgrid angle=" might be quite useful
Simrad setup or similar? digital out?
For old paper Sidescan Sonar recorders + GPS track the new thin plate
spline warping in gdalwarp has given me much better results than with
Caris GIS or ERDAS. A few bumps along the way but in the end a pretty
smooth process.
Someone made a good free (beer) data viewer for swath data.. can't
remember the name now ![]() I'll rereply if it comes to me.
I'll rereply if it comes to me.
Ocean Data View isn't really what you're after, but maybe useful:
http://odv.awi-bremerhaven.de/
Also check out Bob's Tekmap website. http://www.tekmap.ns.ca/
Hamish
I tried to put together a little script to test out some ideas. Things
worked OK to a point. I ran into limits on the number of segments I
could add to a line with v.split which limits the resolution of the
resulting swath map. I also ran into problems with v.buffer which did
not buffer the lines in the way I would expect. I put together a web
page with a visual of what I mean (use the script copied below):
http://david.p.finlayson.googlepages.com/swathwidth
I would love to hear any comments on how to do this better.
---- test script ----
#!/bin/bash
# Visualize SWATH coverage from a line
LINE=survey # A vector line
DEM=psdem2005 # An elevation raster
BEAM_MULT=3 # Beam width multiple of water depth
# Split the line into cell-sized segments (Can't do this, I get
# a out of memory error if the number of segments gets too large
EWRES=`r.info -s map=$DEM | grep ns | cut -d= -f2`
g.remove vect=temp_split
v.split input=$LINE output=temp_split length=100
# Now remove duplicate categories (for each segment) and
# renumber consecutively
g.remove vect=temp_split2
v.category input=temp_split output=temp_split2 option=del
g.remove vect=temp_split3
v.category input=temp_split2 output=temp_split3 option=add
# Attribute each line with an elevation and upload to the
# attribute table
g.remove vect=temp_drape
v.drape input=temp_split3 type=line rast=$DEM output=temp_drape
v.db.addtable temp_drape col="x double, y double, z double" layer=1
v.to.db map=temp_drape type=line option=start col=x,y,z layer=1
# Assign z value to segments from dem. Then calculate the width
# of the beam as a function of water depth and store this in a
# second (layer 2) attribute table
echo "DROP TABLE temp_drape2" | db.execute
echo "create table temp_drape2 as select cat, x, y, z, -1 * $BEAM_MULT
* z as width from temp_drape" | db.execute
echo "update temp_drape2 set width = 0 where width < 0" | db.execute
v.db.connect -o map=temp_drape table=temp_drape2 layer=1
# Buffer the line segments based on the width attribute (This doesn't
# do what I expected)
g.remove vect=temp_buff
v.buffer input=temp_drape output=temp_buff type=line layer=1
bufcol=width tolerance=0.01
# Convert to buffered vector to a raster
g.remove rast=survey_buff
v.to.rast input=temp_buff output=survey_buff use=val value=1
---- end script ----
On 4/20/06, Patton, Eric <epatton@nrcan.gc.ca> wrote:
David,
What water depths will you be working at? I ask because you can usually plan
parallel lines in deeper water where you don't have to contend with islands,
shoals, fishing gear, etc. We use Regulus software from ICAN as our nav
package for swath surveys, but all it really does is plot parallel lines of
a given length and angle orientation, (i.e. v.parallel, v.digit). For
non-parallel survey grids, we really just digitize arbitrary survey tracks.I'm not sure if the MB-System has a survey grid making tool, maybe worth a
check:
http://www.ldeo.columbia.edu/res/pi/MB-System/~ Eric.
-----Original Message-----
From: owner-GRASSLIST@baylor.edu
To: David Finlayson
Cc: GRASSLIST@baylor.edu
Sent: 4/19/2006 11:48 PM
Subject: [GRASSLIST:773] Re: Planning swath bathymetry surveys> Has anyone built a tool to assist in planning SWATH bathymetry surveys
> in GRASS? Alternatively, do you know of a tool that would take
> existing bathymetry as input and help me plan survey lines?r.transect -g, r.profile -g
and make vector lines from result, then v.buffer?
That way might be fairly labor intensive without a script.
just use v.digit or QGIS digitization of lines over a DEM backdrop?how much will depth vary? (as beam width & space between tracks will
increase with depth)"v.mkgrid angle=" might be quite useful
Simrad setup or similar? digital out?
For old paper Sidescan Sonar recorders + GPS track the new thin plate
spline warping in gdalwarp has given me much better results than with
Caris GIS or ERDAS. A few bumps along the way but in the end a pretty
smooth process.Someone made a good free (beer) data viewer for swath data.. can't
remember the name nowI'll rereply if it comes to me.
Ocean Data View isn't really what you're after, but maybe useful:
http://odv.awi-bremerhaven.de/Also check out Bob's Tekmap website. http://www.tekmap.ns.ca/
Hamish
--
David Finlayson
I tried to put together a little script to test out some ideas. Things
worked OK to a point. I ran into limits on the number of segments I
could add to a line with v.split which limits the resolution of the
resulting swath map. I also ran into problems with v.buffer which did
not buffer the lines in the way I would expect. I put together a web
page with a visual of what I mean (use the script copied below):http://david.p.finlayson.googlepages.com/swathwidth
I would love to hear any comments on how to do this better.
v.what.rast maybe more efficient than of v.drape steps?
Instead of v.to.rast at the end, make a vector "hull" with
'v.extract -d' or v.hull?
1) "It appears that v.buffer buffers the nodes on the line segments
rather than drawing parallel lines at the appropriate distance from
the centerline."
I don't think that is right, if the input feature is a line.
If the input features are points, then of course.
v.buffer bufcol= is not bug free. Nothing like you describe though.
But are you buffering points, not lines ?!
If bulcol= is the problem, use a loop: for each point v.buffer+v.patch.
"2) v.split out-of-memory errors?
I found that v.split can not segment an input line into an arbitrary
number of segments. The upper bound seems to be <1000 segments per line
before getting an out of memory error."
Sounds like a memory leak, can you file a bug report?
maybe you could try using "valgrind" to see what's filling up?
http://bambi.otago.ac.nz/hamish/grass/memleak/v.in.ascii/
"3) v.db.addtable sends weird messages to the screen:
First, it posts an ERROR that the table I am about to create does not
exist. Isn't the whole point of v.db.addtable to create a new table??"
Known issue. I had thought there was something in the script or help
page that told you to ignore those errors, but I can't find it now.
They are harmless.
Probably better use of "2>&1 > /dev/null" in the script is needed.
The script tests to see if a table is connected before adding a new
layer, the errors happen then if it doesn't find one. Based on the
return code it either does one thing or another. stderr can (carefully)
be redirected to /dev/null on the query steps to silence these.
"Second, it posts a WARINING that the attached table can be deleted if
the vector is deleated. I would resurve the keyword WARNING for
processes that have completed with errors. In this case, this is just a
Note from the creater of the script not to hurt yourself and has nothing
to do with the actual process of v.db.addtable at all. I would recommend
changing the wording to NOTE or CAUTION or better yet, put this info in
the manual where it belongs and don't clutter up the command line with
it (we get the picture the second time we use the command)."
This is given by v.db.connect, which v.db.addtable calls.
If you have connected to an outside table it is very important to know
that the table will be removed if the map is removed! If the GIS created
the table just for the map, then it's not so much of a problem.
In this case the existing table we connect to is the one we just made,
so the warning can probably be sent to /dev/null. But if there is a
real error you will then miss it.
Hamish
On Mon, 24 Apr 2006 18:34:07 +1200
Hamish <hamish_nospam@yahoo.com> wrote:
1) "It appears that v.buffer buffers the nodes on the line segments
rather than drawing parallel lines at the appropriate distance from
the centerline."I don't think that is right, if the input feature is a line.
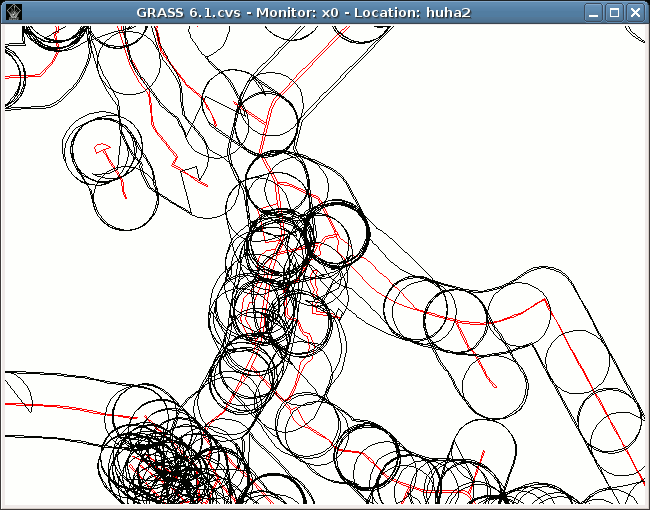
I guess statement 1) is somewhat right. See the attached screendump.
Red is the input lines, black is the output of the command:
v.buffer input=x_extr output=buffer type=boundary layer=1 buffer=100
scale=1.0 tolerance=0.01 debug=buffer
The dataset to reproduce this is here:
http://www.biol.uni.wroc.pl/sieczka/udostepnione/grass/huha2.tar.bz2
[3,3 MB]
(I've put it there as a testing case for bug report
http://intevation.de/rt/webrt?serial_num=4164)
Maciek
--------------------
W polskim Internecie s? setki milion?w stron. My przekazujemy Tobie tylko najlepsze z nich!
http://katalog.panoramainternetu.pl/
David,
Very interesting! I haven't had time to test your script out, but just off
the top of my head, could your v.split problem be solved by using v.segment
or v.to.points, perhaps? I'm just throwing this out there, I don't know what
the advantages if any are from using one of these over another.
In general I think this is going to be a very useful addition to Grass,
especially for my work. I'll try to add more useful feedback after I can
make some time to play around with it.
Thanks!
~ Eric.
-----Original Message-----
From: David Finlayson
To: Patton, Eric
Cc: Hamish; GRASSLIST@baylor.edu
Sent: 4/23/2006 2:11 AM
Subject: Re: [GRASSLIST:773] Re: Planning swath bathymetry surveys
I tried to put together a little script to test out some ideas. Things
worked OK to a point. I ran into limits on the number of segments I
could add to a line with v.split which limits the resolution of the
resulting swath map. I also ran into problems with v.buffer which did
not buffer the lines in the way I would expect. I put together a web
page with a visual of what I mean (use the script copied below):
http://david.p.finlayson.googlepages.com/swathwidth
I would love to hear any comments on how to do this better.
---- test script ----
#!/bin/bash
# Visualize SWATH coverage from a line
LINE=survey # A vector line
DEM=psdem2005 # An elevation raster
BEAM_MULT=3 # Beam width multiple of water depth
# Split the line into cell-sized segments (Can't do this, I get
# a out of memory error if the number of segments gets too large
EWRES=`r.info -s map=$DEM | grep ns | cut -d= -f2`
g.remove vect=temp_split
v.split input=$LINE output=temp_split length=100
# Now remove duplicate categories (for each segment) and
# renumber consecutively
g.remove vect=temp_split2
v.category input=temp_split output=temp_split2 option=del
g.remove vect=temp_split3
v.category input=temp_split2 output=temp_split3 option=add
# Attribute each line with an elevation and upload to the
# attribute table
g.remove vect=temp_drape
v.drape input=temp_split3 type=line rast=$DEM output=temp_drape
v.db.addtable temp_drape col="x double, y double, z double" layer=1
v.to.db map=temp_drape type=line option=start col=x,y,z layer=1
# Assign z value to segments from dem. Then calculate the width
# of the beam as a function of water depth and store this in a
# second (layer 2) attribute table
echo "DROP TABLE temp_drape2" | db.execute
echo "create table temp_drape2 as select cat, x, y, z, -1 * $BEAM_MULT
* z as width from temp_drape" | db.execute
echo "update temp_drape2 set width = 0 where width < 0" | db.execute
v.db.connect -o map=temp_drape table=temp_drape2 layer=1
# Buffer the line segments based on the width attribute (This doesn't
# do what I expected)
g.remove vect=temp_buff
v.buffer input=temp_drape output=temp_buff type=line layer=1
bufcol=width tolerance=0.01
# Convert to buffered vector to a raster
g.remove rast=survey_buff
v.to.rast input=temp_buff output=survey_buff use=val value=1
---- end script ----
On 4/20/06, Patton, Eric <epatton@nrcan.gc.ca> wrote:
David,
What water depths will you be working at? I ask because you can
usually plan
parallel lines in deeper water where you don't have to contend with
islands,
shoals, fishing gear, etc. We use Regulus software from ICAN as our
nav
package for swath surveys, but all it really does is plot parallel
lines of
a given length and angle orientation, (i.e. v.parallel, v.digit). For
non-parallel survey grids, we really just digitize arbitrary survey
tracks.
I'm not sure if the MB-System has a survey grid making tool, maybe
worth a
check:
http://www.ldeo.columbia.edu/res/pi/MB-System/~ Eric.
-----Original Message-----
From: owner-GRASSLIST@baylor.edu
To: David Finlayson
Cc: GRASSLIST@baylor.edu
Sent: 4/19/2006 11:48 PM
Subject: [GRASSLIST:773] Re: Planning swath bathymetry surveys> Has anyone built a tool to assist in planning SWATH bathymetry
surveys
> in GRASS? Alternatively, do you know of a tool that would take
> existing bathymetry as input and help me plan survey lines?r.transect -g, r.profile -g
and make vector lines from result, then v.buffer?
That way might be fairly labor intensive without a script.
just use v.digit or QGIS digitization of lines over a DEM backdrop?how much will depth vary? (as beam width & space between tracks will
increase with depth)"v.mkgrid angle=" might be quite useful
Simrad setup or similar? digital out?
For old paper Sidescan Sonar recorders + GPS track the new thin plate
spline warping in gdalwarp has given me much better results than with
Caris GIS or ERDAS. A few bumps along the way but in the end a pretty
smooth process.Someone made a good free (beer) data viewer for swath data.. can't
remember the name nowOcean Data View isn't really what you're after, but maybe useful:
http://odv.awi-bremerhaven.de/Also check out Bob's Tekmap website. http://www.tekmap.ns.ca/
Hamish
--
David Finlayson
> 1) "It appears that v.buffer buffers the nodes on the line segments
> rather than drawing parallel lines at the appropriate distance from
> the centerline."
>
> I don't think that is right, if the input feature is a line.I guess statement 1) is somewhat right. See the attached screendump.
Red is the input lines, black is the output of the command:v.buffer input=x_extr output=buffer type=boundary layer=1 buffer=100
scale=1.0 tolerance=0.01 debug=buffer
I don't see the problem? Sure as part of the processing it buffers about
nodes, but after a disolve common boundaries cleaning step the buffer
looks correct between nodes as well? (see ski jump mid-right side of your
image)
Hamish
On Wed, 26 Apr 2006 15:23:39 +1200
Hamish <hamish_nospam@yahoo.com> wrote:
> > 1) "It appears that v.buffer buffers the nodes on the line
> > segments rather than drawing parallel lines at the appropriate
> > distance from the centerline."
> >
> > I don't think that is right, if the input feature is a line.
>
> I guess statement 1) is somewhat right. See the attached screendump.
> Red is the input lines, black is the output of the command:
>
> v.buffer input=x_extr output=buffer type=boundary layer=1 buffer=100
> scale=1.0 tolerance=0.01 debug=bufferI don't see the problem? Sure as part of the processing it buffers
about nodes, but after a disolve common boundaries cleaning step the
buffer looks correct between nodes as well? (see ski jump mid-right
side of your image)
Why does it buffer around nodes anyway while we want it to buffer
around lines (only)?
Maciek
--------------------
W polskim Internecie s? setki milion?w stron. My przekazujemy Tobie tylko najlepsze z nich!
http://katalog.panoramainternetu.pl/
I've simplified my script a bit based on Hamish's suggestions. But I
still can't figure out how to get the vector areas to equal the vector
boundaries. I have messed around with v.clean a bit, but haven't
stumbled on the solution yet. Here is an update to the script and
another picture of what I am writing about:
http://pages.google.com/edit/david.p.finlayson/swathwidth
For my problem, buffering the nodes with circles means that the buffer
is working both normal to my line (which is what I want) but also
parallel to my line which is not ok for my application. Swath beams
don't spread out in a circle, they are thin rectangles. So, the
planning tool I am working on will overestimate the swath coverage
when the survey crosses from deep to shallow water (or vis-a-vis).
On 4/26/06, Maciek Sieczka <werchowyna@epf.pl> wrote:
On Wed, 26 Apr 2006 15:23:39 +1200
Hamish <hamish_nospam@yahoo.com> wrote:> > > 1) "It appears that v.buffer buffers the nodes on the line
> > > segments rather than drawing parallel lines at the appropriate
> > > distance from the centerline."
> > >
> > > I don't think that is right, if the input feature is a line.
> >
> > I guess statement 1) is somewhat right. See the attached screendump.
> > Red is the input lines, black is the output of the command:
> >
> > v.buffer input=x_extr output=buffer type=boundary layer=1 buffer=100
> > scale=1.0 tolerance=0.01 debug=buffer
>
>
> I don't see the problem? Sure as part of the processing it buffers
> about nodes, but after a disolve common boundaries cleaning step the
> buffer looks correct between nodes as well? (see ski jump mid-right
> side of your image)Why does it buffer around nodes anyway while we want it to buffer
around lines (only)?Maciek
--------------------
W polskim Internecie s? setki milion?w stron. My przekazujemy Tobie tylko najlepsze z nich!
http://katalog.panoramainternetu.pl/
--
David Finlayson
I've simplified my script a bit based on Hamish's suggestions. But I
still can't figure out how to get the vector areas to equal the vector
boundaries. I have messed around with v.clean a bit, but haven't
stumbled on the solution yet.
making sure all cat numbers are the same and then using 'v.extract -d'
doesn't work??
v.overlay instead of v.patch in a loop?
Here is an update to the script and
another picture of what I am writing about:
doesn't work (we can't edit^^^ your page)
For my problem, buffering the nodes with circles means that the buffer
is working both normal to my line (which is what I want) but also
parallel to my line which is not ok for my application. Swath beams
don't spread out in a circle, they are thin rectangles. So, the
planning tool I am working on will overestimate the swath coverage
when the survey crosses from deep to shallow water (or vis-a-vis).
what if instead of v.buffer you use v.mkgrid, 1 grid box long & thin
with appropriate angle= setting? Maybe make two symetrical grid boxes,
one each side of the track line to make the origin easier to calculate.
Hamish
> > > 1) "It appears that v.buffer buffers the nodes on the line
> > > segments rather than drawing parallel lines at the appropriate
> > > distance from the centerline."
> > >
> > > I don't think that is right, if the input feature is a line.
> >
> > I guess statement 1) is somewhat right. See the attached
> > screendump. Red is the input lines, black is the output of the
> > command:
> >
> > v.buffer input=x_extr output=buffer type=boundary layer=1
> > buffer=100 scale=1.0 tolerance=0.01 debug=buffer
>
> I don't see the problem? Sure as part of the processing it buffers
> about nodes, but after a disolve common boundaries cleaning step the
> buffer looks correct between nodes as well? (see ski jump mid-right
> side of your image)Why does it buffer around nodes anyway while we want it to buffer
around lines (only)?
I still do not follow exactly what you are asking for...
For a single line, you want the buffer to have square ends, not rounded?
Distance from end point of a road is still distance from the road, yes?
Node is always on the line, so it doesn't matter if it buffers along
them as well as the line. ???
Hamish
The link should be:
http://david.p.finlayson.googlepages.com/swathwidth
On 4/26/06, Hamish <hamish_nospam@yahoo.com> wrote:
> > > > 1) "It appears that v.buffer buffers the nodes on the line
> > > > segments rather than drawing parallel lines at the appropriate
> > > > distance from the centerline."
> > > >
> > > > I don't think that is right, if the input feature is a line.
> > >
> > > I guess statement 1) is somewhat right. See the attached
> > > screendump. Red is the input lines, black is the output of the
> > > command:
> > >
> > > v.buffer input=x_extr output=buffer type=boundary layer=1
> > > buffer=100 scale=1.0 tolerance=0.01 debug=buffer
> >
> > I don't see the problem? Sure as part of the processing it buffers
> > about nodes, but after a disolve common boundaries cleaning step the
> > buffer looks correct between nodes as well? (see ski jump mid-right
> > side of your image)
>
> Why does it buffer around nodes anyway while we want it to buffer
> around lines (only)?I still do not follow exactly what you are asking for...
For a single line, you want the buffer to have square ends, not rounded?
Distance from end point of a road is still distance from the road, yes?Node is always on the line, so it doesn't matter if it buffers along
them as well as the line. ???Hamish
--
David Finlayson
Ok, here you go.. working with a spearfish example:
g.region n=4926340 s=4921410 w=590010 e=592930 res=10
r.mapcalc bathy=elevation.10m-1250
r.colors bathy rule=terrain
v.in.ascii -n format=standard out=survey << EOF
L 2
591046 4924704
592377 4924468
EOF
#1.35km long
BEAM_MULT=3
DEM=bathy
LINE=survey
v.to.points input=$LINE output=temp_point dmax=100
d.rast $DEM
d.vect $LINE
d.stations temp_point #wiki add-ons
v.db.addcol map=temp_point layer=2 columns="elev double"
v.what.rast vect=temp_point rast=temp_swath layer=2 col=elev
v.buffer input=temp_point output=temp_circles type=point layer=2 \
bufcol=elev debug=buffer
# As stated before, "v.buffer bufcol=" is buggy in the cleaning step,
# which is why you get only center area as solid. So we do it manually:
# break polygons at intersections (flatten circles)
v.clean in=temp_circles out=temp_circles2 tool=break
# add centroids making areas
v.category in=temp_circles2 out=temp_circles3 step=0
# disolve common boundaries
v.extract -d type=area in=temp_circles3 out=temp_circles4
# (this works, maybe a clue as how to process bufcol data in v.buffer??)
# cleanup
g.rename v=temp_circles4,swath_area
g.mremove -f vect=temp_circles*
Done! One worm created.
proof: http://bambi.otago.ac.nz/hamish/grass/swath.png
# query area
d.what.vect -x
swath_area in user1 Area
Size - Sq Meters: 595889.059 Hectares: 59.589
Acres: 147.244 Sq Miles: 0.2301
# or
v.report swath_area op=area units=kilometers
|1|0.595889058998155
v.to.rast...
r.mapcalc MASK=...
r.univar ...
etc.
I really encourage you to try and get the v.mkgrid solution working, as the
results will be much more "real".
Hamish
Thanks for your help Hamish.
I'm still learning the ins and outs of vectors and it doesn't always
make sense to read the man pages. I couldn't find a way to dissolve
the areas into a single unit. v.extract -d did the trick!
There was quite a bit of magic in that script you built, though you've
been so deep in GRASS (I suspect) I doubt that you see it.
For the rest of us:
1. v.buffer left us with a borked vector file. Huge, criss-crossing
boundary lines which only defined a few actual areas (that is, only a
few of the enclosed spaces had centroids).
2. You used v.clean tool=break to break the criss-crossing boundary
lines at intersections. There were still no centroids in most of the
enclosed spaces.
3. This is confusing: You then used v.category to add centroids to all
of the potential areas? How did v.category know where the new areas
were?? What happened here? Why is a command called v.category adding
centroids? (Magic #1)
4. Once you've got closed boundaries and a centroid for each enclosed
space, presto these are now areas!? Was this also a bit of v.category
magic? Now v.category turns boundaries + centroid into areas. Maybe
v.category is a bad name for this module (suggest: v.makearea)? (Magic
#2)
5. Now you extract all of the areas with a category = 0 and dissolve
them into a single area using v.extract -d. This is documented, but I
never thought to look at extract to do a dissolve. (Hidden Gem #1)
6. End result: a vector with a single area that represents the total
area of the buffered line above.
Cool, but weird.
David
On 4/27/06, Hamish <hamish_nospam@yahoo.com> wrote:
> http://david.p.finlayson.googlepages.com/swathwidth
..
> 3) v.db.addtable sends weird messages to the screen:
>
> First, it posts an ERROR that the table I am about to create does not
> exist. Isn't the whole point of v.db.addtable to create a new table??v.db.addtable updated in CVS to make those go away.
(superfluous test output)While doing this I found a segfault in v.to.db for layer >1, see
following report..Hamish
--
David Finlayson
I posted the latest version of the swath mapping script to the Wiki:
http://grass.gdf-hannover.de/twiki/bin/view/GRASS/GrassAddOns#grass6vector
v.swathwidth
It's usable now and not too resource intensive. I will work on
Hamish's suggestion to try v.mkgrd if I have time. It looks like that
might be a good way to get what I want, but, I think I would need
Python which adds a dependency to the script.
David
On 4/28/06, Markus Neteler <neteler@itc.it> wrote:
David Finlayson wrote:
>Thanks for your help Hamish.
>
>I'm still learning the ins and outs of vectors and it doesn't always
>make sense to read the man pages. I couldn't find a way to dissolve
>the areas into a single unit. v.extract -d did the trick!
>David,
we depend also on YOU to improve the documentation
Please feel free to suggest text pieces to insert. I am more that happy
to do
that.Markus
--
David Finlayson
Thanks for your help Hamish.
No worries, this is something I will use.
I'm still learning the ins and outs of vectors and it doesn't always
make sense to read the man pages. I couldn't find a way to dissolve
the areas into a single unit. v.extract -d did the trick!There was quite a bit of magic in that script you built, though you've
been so deep in GRASS (I suspect) I doubt that you see it.For the rest of us:
1. v.buffer left us with a borked vector file. Huge, criss-crossing
boundary lines which only defined a few actual areas (that is, only a
few of the enclosed spaces had centroids).
note debug= was used to stop the module before cleaning. The v.clean
step might be avoided if this is omitted or set to something else. ?
2. You used v.clean tool=break to break the criss-crossing boundary
lines at intersections. There were still no centroids in most of the
enclosed spaces.
Yes, that tool does just what it says.
3. This is confusing: You then used v.category to add centroids to all
of the potential areas? How did v.category know where the new areas
were?? What happened here? Why is a command called v.category adding
centroids? (Magic #1)
Yes.. Markus just reminded me where this one lived about two weeks ago.
"you can't add cat numbers without centroids?" (thin logic...)
What really does the magic is the Vect_get_point_in_area() library
function, in lib/vector/Vlib/poly.c
/*!
\fn int Vect_get_point_in_area( struct Map_info *Map, int area, double
*X, double *Y)
\brief get point inside area and outside all islands
Take a line and intersect it with the polygon and any islands.
sort the list of X values from these intersections. This will
be a list of segments alternating IN/OUT/IN/OUT of the polygon.
Pick the largest IN segment and take the midpoint.
\return 0 on success, -1 on error
\param Map_info structure, area number, x, y
*/
If v.category doesn't find a centroid it uses that fn to find out where
to put it and then goes ahead and adds it. I suppose this could be added
as a v.clean tool or somewhere else more appropriate..?
4. Once you've got closed boundaries and a centroid for each enclosed
space, presto these are now areas!?
*YES*. area=centroid+boundary. An area is defined as a boundary (usually
without attributes or even category number) containing a centroid. If
the area does not contain a centroid it is considered to be a hole/
island, and most modules will treat it as such (ie ignore it). The same
goes for any feature without a category number. Besides holding the cat
number, the centroid is where attributes about the area are held.
it is touched upon in:
http://grass.ibiblio.org/grass61/manuals/html61_user/vectorintro.html
note how "v.to.db type=" won't let you pull from "area".
Was this also a bit of v.category magic? Now v.category turns
boundaries + centroid into areas. Maybe v.category is a bad name for
this module (suggest: v.makearea)? (Magic #2)
as soon as there is a centroid inside a boundary you have an area.
experiment with v.digit a bit and watch the lines change color.
v.category is still for doing things to categories, the question is if
this "feature" should be promoted to its own v.clean tool. Code
replication is bad, as if a bug is found it usually only gets fixed in
one of the occurances.
5. Now you extract all of the areas with a category = 0
No, I set all categories to "1" to have all areas with common cat
number. Starting point was 1 and step was 0 so result is 1,1,1,1,1,..
instead of normal 1,2,3,4,5,6,7,...
and dissolve them into a single area using v.extract -d. This is
documented, but I never thought to look at extract to do a dissolve.
(Hidden Gem #1)
Ok, this one's my fault. I don't exactly remember why, but think of it
as "extract the outer boundary" and it makes more sense. Everything was
already in place in that module which is why it was so easy to add there
using only a flag.
6. End result: a vector with a single area that represents the total
area of the buffered line above.Cool, but weird.
With time features may migrate to more obvious homes.. be they the same
libary fns called from new tools or from script frontends like
v.what.vect.
Hamish
On Mon, 1 May 2006 22:44:43 +1200
Hamish <hamish_nospam@yahoo.com> wrote:
<snip>
note how "v.to.db type=" won't let you pull from "area".
As a side note to this, what do we do with this issue:
http://intevation.de/rt/webrt?serial_num=4044
I have just checked v.to.db manual from CVS just a while ago and the
"type=area" examples are still there...
Maciek
--------------------
W polskim Internecie s? setki milion?w stron. My przekazujemy Tobie tylko najlepsze z nich!
http://katalog.panoramainternetu.pl/