Final Report
Title: Improve GRASS user experience in Jupyter Notebook
Organization: GRASS GIS - OSGeo
Wiki Page: GRASS GSoC 2024 Improve user experience in Jupyter Notebooks
1. Abstract
This project introduces three significant enhancements to the InteractiveMap: a Query Button for querying specific points, a View/Update Computational Region Button for directly viewing and updating the computational region, and a Draw Geometries Button for creating and adding simple geometries as GRASS native vector maps. Additionally, the project introduces the BaseSeriesMap to reduce redundancy between SeriesMap and TimeSeriesMap, and adds parallelization to both SeriesMap and TimeSeriesMap for improved performance.
2. The state of integration BEFORE the start of GSoC
Previously, it was not possible to query vector/raster data, draw geometries, or view the computational region in InteractiveMap. While updating the region was possible, it required running additional commands. Additionally, improving the rendering speed of images in SeriesMap and TimeSeriesMap was not feasible.
3. The state of integration AFTER GSoC
3.1 Features in grass.InteractiveMap()
The grass.jupyter.interactivemap.py module includes three key features: the Query button (![]() ), the View/Update Computational Region button (
), the View/Update Computational Region button (![]() ), and the Draw Geometries button (🖉).
), and the Draw Geometries button (🖉).
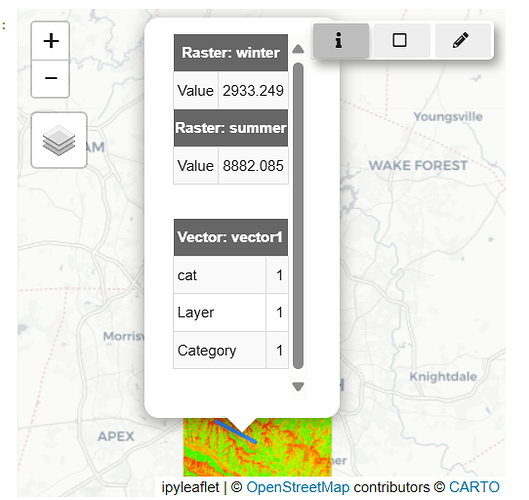
3.1.1 Querying Raster/Vector Information at a Specific Point ( )
)
- Activate the Query Tool: Click the
infobutton ( ) to enable the query mode.
 - Select a Point on the Map: Click on the map to retrieve raster/vector information for that specific point.
- Deactivate the Tool: Toggle the button off when you’re done.
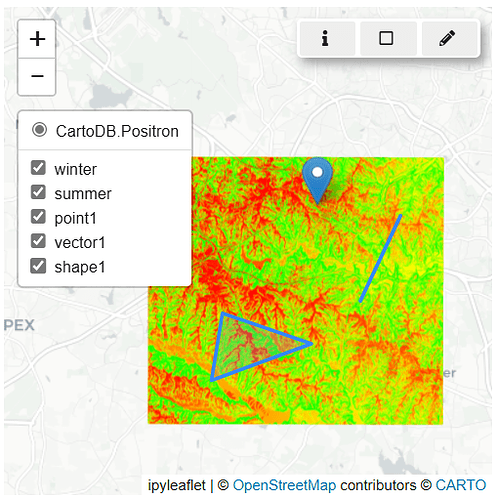
3.1.2 Drawing and Saving Geometries as GRASS Native Vector Maps (🖉)
- Activate the Drawing Tool: Click the
Pencilbutton (🖉) to start drawing on the map. - Draw Your Geometry: You can draw a polyline, polygon, or circle marker directly on the map.
- Name the Vector Map: Enter the name for the new vector map in the
New vector map nametext box. - Save the Geometry: Click the
Savebutton to add the geometry to the map. - Finalize and Close: The geometry is now added as a new layer on the map, and the drawing interface will automatically close.
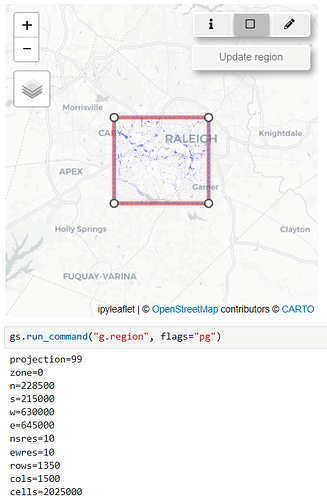
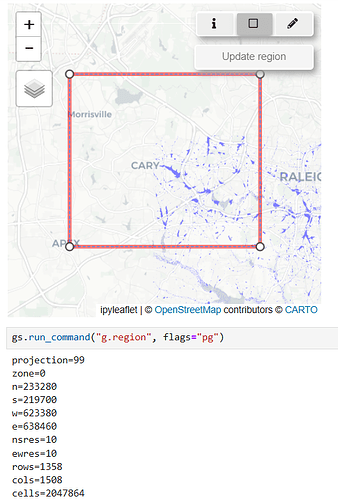
3.1.3 Viewing and Updating the Computational Region ( )
)
- Activate the Computational Region Tool: Click the
View/Update Computational Regionbutton ( ).
). - Visualize the Current Region: The current computational region is displayed as a rectangle on the map.
- Adjust the Region: Move the rectangle to a new location or resize it by dragging its vertices.
- Update the Region: Click
Update Regionto apply your changes to the computational region. - Deactivate the Tool: Toggle the button off when you’re done.
3.2 Removal of redundancy in the TimeSeriesMap and SeriesMap
A new class, BaseSeriesMap, has been added to serve as a parent class to both TimeSeriesMap and SeriesMap. This enhancement reduces redundancy and streamlines the codebase.
3.3 Parallelization in SeriesMap and TimeSeriesMap
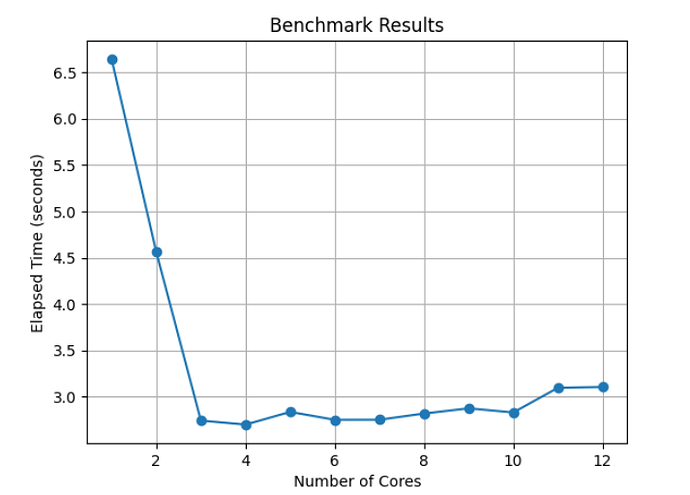
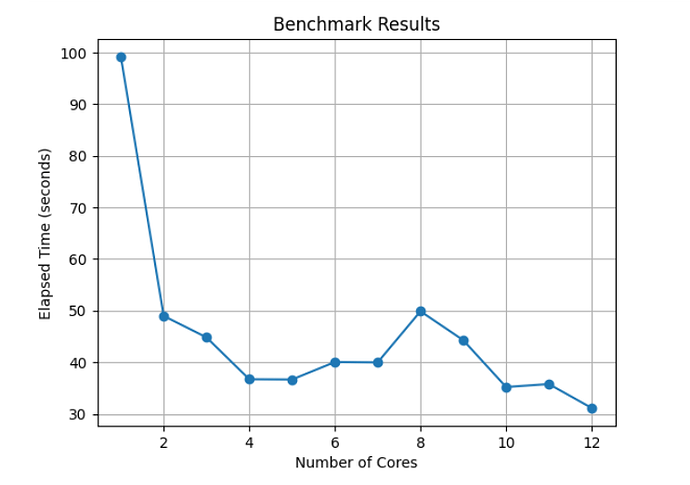
Benchmark for TimeSeriesMap and SeriesMap: The following tables present the performance results obtained using 1-12 cores, as tested on the examples in temporal.ipynb and jupyter_tutorial.ipynb. Below is an example of how to reproduce this benchmark:
cores_range = range(1, 13)
benchmark_results = {}
for cores in cores_range:
    gs.run_command("g.gisenv", set=f"NPROCS={cores}")
    start_time = time.time()
    series = gj.SeriesMap(height=500)
    series.add_rasters(["elevation", "elevation_shade", "slope"])
    series.add_vectors(["streams", "streets", "viewpoints"])
    series.d_vect(map="streets")
    series.d_barscale()
    series.show()  # Create Slider
    end_time = time.time()
    elapsed_time = end_time - start_time
    benchmark_results[cores] = elapsed_time
    print(f"Cores: {cores}, Time: {elapsed_time:.2f} seconds")
| Cores | 1 | 2 | 3 | 4 | 5 | 6 | 7 | 8 | 9 | 10 | 11 | 12 |
|---|---|---|---|---|---|---|---|---|---|---|---|---|
| Time (sec) | 53.42 | 26.24 | 18.99 | 18.50 | 15.08 | 14.04 | 17.68 | 15.75 | 16.00 | 14.12 | 14.22 | 14.76 |
| Cores | 1 | 2 | 3 | 4 | 5 | 6 | 7 | 8 | 9 | 10 | 11 | 12 |
|---|---|---|---|---|---|---|---|---|---|---|---|---|
| Time (sec) | 4.88 | 2.47 | 1.58 | 1.67 | 1.74 | 1.73 | 1.68 | 1.64 | 1.65 | 1.64 | 1.62 | 1.61 |
4. Conclusion
This project has successfully improved the user experience of GRASS GIS in Jupyter Notebook. Significant enhancements have been made to the InteractiveMap, SeriesMap, and TimeSeriesMap. The new features, such as the Query Button, View/Update Computational Region Button, and Draw Geometries Button, have streamlined data querying, visualization, and editing processes. Introducing the BaseSeriesMap has reduced redundancy, and parallelization has substantially improved performance. Benchmark results show notable speed improvements, making GRASS GIS more efficient and user-friendly. These advancements contribute to a more seamless and productive experience for users.
I appreciate the support and opportunity to contribute to GRASS GIS this summer. Thanks to my mentors and the GRASS Development Team for their guidance. Anna Petrasova’s contributions were pivotal to the project’s success, and I’m grateful for her support. Looking forward to contributing more.
5. Future Work
- Improve the distance used in Query Button functionality.
- Use
GeomanDrawControlin the Draw Button functionality. - Enhanced connectivity with Pandas will enable users to display data with a single command.
- Large, high-resolution image display will be enabled by implementing tiling techniques, reducing memory consumption and enabling smooth rendering of large images.
- Implementing a graphical user interface (GUI) for tool presentation within Jupyter Notebooks would simplify usability and enhance user experience, facilitating smoother workflows within the platform.
6. Links
6.1 Pull requests related to grass.jupyter:
| Title | Pull Request | Status |
|---|---|---|
| Create BaseSeriesMap to remove redundancies in SeriesMap and TimeSeriesMap | #3468 | Merged |
| Add Query Button to InteractiveMap | #3793 | Merged |
| Allow Users to view/update computational region | #3838 | Merged |
| Allow users to draw simple geometries and save it as vector | #4003 | Merged |
| Add Parallelization to TimeSeriesMap and SeriesMap | #4097 | Merged |
Use InteractiveMap with custom projections |
#4204 | Open |
| Add documentation of InteractiveMap Features and Parallelization in jupyter_tutorial.ipynb | #4164 | Merged |
| Modify Descriptions | #4159 | Merged |
6.2 Some additional links:
| Title | Link |
|---|---|
| OSGeo Wiki Page | Improve User Experience in Jupyter Notebooks |
| Github Fork | GitHub Fork |
| Example | jupyter_tutorial |
7. Images
8.Media
8.1 GIFs
| Working of Update region button | Working of the Draw Button | Working of the Query Button |
|---|---|---|
