Hi everybody.
I’m trying to create a project in LWC with real time device position by the second…i already have that being stored in a PostGis database, but instead of the LWC requests the latest positions from the database, I want to inject it directly on the LWC.
I have a websocket service running in node-red that outputs something like this:
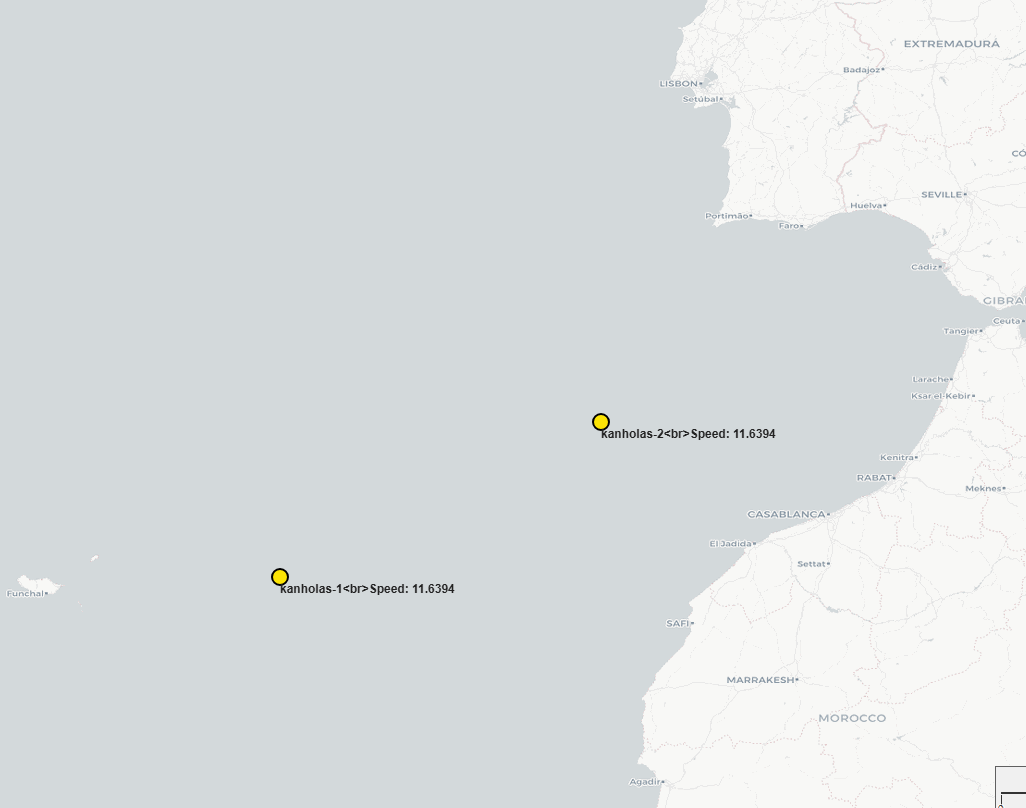
{"name":"kanholas-1","lat":38.8663,"lon":-8.55705,"label":"kanholas-1, Speed: 73.37838","popup":"<b>kanholas-1</b><br>Timestamp: 2025-07-01T13:14:43<br>Depth/Altitude: 10.1081<br>Speed: 73.37838<br>Altitude: 10.1081","icon":"fa-circle-o","iconColor":"#fce405","ttl":"0.1","labelOffset":[0,20]}
{"name":"kanholas-2","lat":36.9121,"lon":-10.5139,"label":"kanholas-2, Speed: 32.527797","popup":"<b>kanholas-2</b><br>Timestamp: 2025-07-01T13:14:46<br>Depth/Altitude:0<br>Speed: 32.527797<br>Altitude: 0","icon":"fa-circle-o","iconColor":"#fce405","ttl":"0.1","labelOffset":[0,20]}
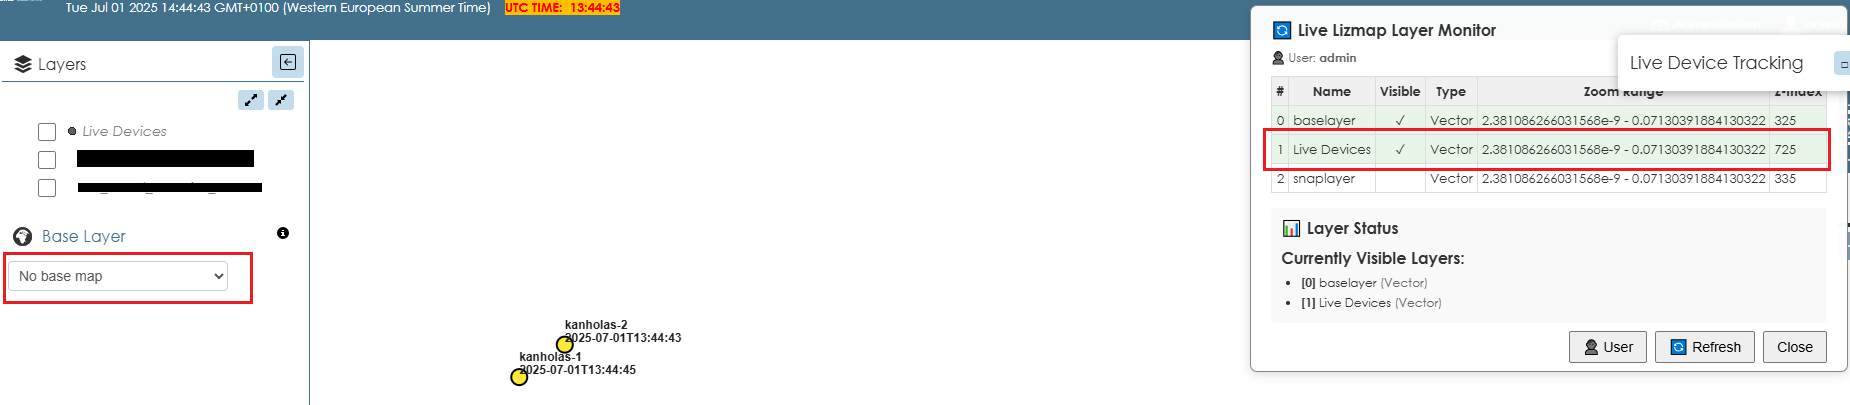
I’m succeeding injecting on LWC, my only problem that I can’t figure out is why it is position below all layers (including the active baselayer)
The only way I can see the points move in real time is to add a “no base map” option on Qgis Desktop using Lizmap plugin:
Can anyone give me a hint how to do this? Here’s my deviceTracker.js
// deviceTracker.js for Lizmap Web Client (Legacy OpenLayers 2 Environment)
// - FINAL ROBUST VERSION
// - SOLVES REDRAW ON PAN/ZOOM: Uses a reliable polling loop (setInterval) to detect
// any change to the map's extent and forces the layer to redraw. This works for
// native Lizmap controls (zoom, pan) and custom buttons.
// - Includes the full-featured UI panel with Zoom and Minimize buttons.
// - Includes a persistent attempt to keep the layer on top.
(function() {
// --- CONFIGURATION ---
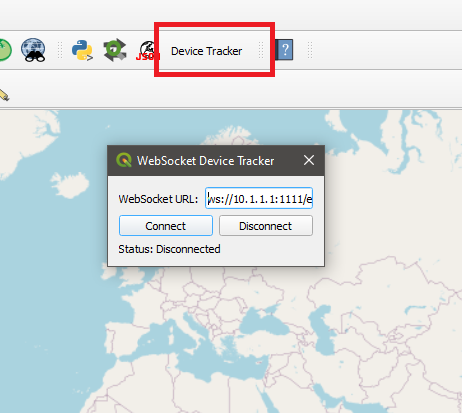
var WEBSOCKET_URL = 'ws://10.1.1.133:1880/device-live';
var POLLING_INTERVAL = 1000; // Check for changes every 1 second for good responsiveness.
// --- LIZMAP INIT ---
lizMap.events.on({
'uicreated': function() {
setTimeout(initDeviceTracker, 1000);
}
});
function initDeviceTracker() {
if (!lizMap.map) {
setTimeout(initDeviceTracker, 500);
return;
}
// --- DYNAMIC STYLE CONTEXT (for per-feature labelOffset) ---
var deviceStyleContext = {
getLabelXOffset: function(feature) { return (feature.attributes.labelOffset && feature.attributes.labelOffset.length > 0) ? feature.attributes.labelOffset[0] : 15; },
getLabelYOffset: function(feature) { return (feature.attributes.labelOffset && feature.attributes.labelOffset.length > 1) ? feature.attributes.labelOffset[1] : 15; }
};
// --- CREATE VECTOR LAYER (OpenLayers 2 API) ---
var deviceLayer = new OpenLayers.Layer.Vector("Live Devices", {
styleMap: new OpenLayers.StyleMap({
"default": new OpenLayers.Style({ pointRadius: 8, fillColor: "${iconColor}", fillOpacity: 0.8, strokeColor: "#000000", strokeWidth: 2, label: "${label}", fontColor: "#222", fontSize: "12px", fontWeight: "bold", labelAlign: "lb", labelXOffset: "${getLabelXOffset}", labelYOffset: "${getLabelYOffset}" }, { context: deviceStyleContext }),
"select": new OpenLayers.Style({ pointRadius: 10, fillColor: "${iconColor}", fillOpacity: 1.0, strokeColor: "#ff0000", strokeWidth: 3, label: "${label}", fontColor: "#c00", fontSize: "13px", fontWeight: "bold", labelAlign: "lb", labelXOffset: "${getLabelXOffset}", labelYOffset: "${getLabelYOffset}" }, { context: deviceStyleContext })
})
});
lizMap.map.addLayer(deviceLayer);
// --- NEW: RELIABLE POLLING FOR MAP CHANGES ---
var previousExtent = null; // Stores the last known map view
setInterval(function() {
if (!lizMap.map || !deviceLayer.getVisibility()) {
return; // Do nothing if map isn't ready or layer is hidden
}
var currentExtent = lizMap.map.getExtent();
if (!currentExtent) {
return;
}
// If the extent has changed since the last check, redraw the layer.
if (!previousExtent || !currentExtent.equals(previousExtent)) {
deviceLayer.redraw({ force: true });
// While we're at it, also re-run our "on top" logic.
try {
var layerDiv = deviceLayer.div || (deviceLayer.renderer && deviceLayer.renderer.root);
if (layerDiv && layerDiv.parentNode) {
layerDiv.parentNode.appendChild(layerDiv);
}
} catch(e) { /* ignore */ }
}
// Store the current view for the next check.
previousExtent = currentExtent;
}, POLLING_INTERVAL);
// --- DEVICE MANAGEMENT (No changes here) ---
var deviceMarkers = new Map();
function updateDevice(deviceData) { /* ... same as before ... */
var name = deviceData.name, lat = deviceData.lat, lon = deviceData.lon, iconColor = deviceData.iconColor||'#fce405', labelOffset = deviceData.labelOffset||[15,15], popupHtml = deviceData.popup||'', timestamp = '', timestampMatch = popupHtml.match(/Timestamp: (.*?)(<br>|$)/);
if(timestampMatch && timestampMatch[1]){ timestamp = timestampMatch[1].trim(); } if (!name || !lat || !lon) return;
var formattedLabel = name; if (timestamp) { formattedLabel += '\n' + timestamp; }
var popupContent = deviceData.popup || '<b>' + name + '</b>';
var lonLat = new OpenLayers.LonLat(lon, lat);
var point = lonLat.transform(new OpenLayers.Projection("EPSG:4326"), lizMap.map.getProjectionObject());
if (deviceMarkers.has(name)) {
var feature = deviceMarkers.get(name); feature.geometry.x = point.lon; feature.geometry.y = point.lat; feature.geometry.clearBounds();
feature.attributes.label = formattedLabel; feature.attributes.popup = popupContent; feature.attributes.iconColor = iconColor; feature.attributes.labelOffset = labelOffset;
deviceLayer.drawFeature(feature);
} else {
var pointGeometry = new OpenLayers.Geometry.Point(point.lon, point.lat);
var feature = new OpenLayers.Feature.Vector(pointGeometry, { name: name, label: formattedLabel, popup: popupContent, iconColor: iconColor, labelOffset: labelOffset });
deviceMarkers.set(name, feature); deviceLayer.addFeatures([feature]);
}
updateDeviceCounter();
}
// --- POPUP CONTROL (No changes here) ---
var selectControl = new OpenLayers.Control.SelectFeature(deviceLayer, {
onSelect: function(feature) { var popup = new OpenLayers.Popup.FramedCloud("devicePopup", feature.geometry.getBounds().getCenterLonLat(), null, feature.attributes.popup, null, true, function() { selectControl.unselect(feature); }); feature.popup = popup; lizMap.map.addPopup(popup); },
onUnselect: function(feature) { if (feature.popup) { lizMap.map.removePopup(feature.popup); feature.popup.destroy(); feature.popup = null; } }
});
lizMap.map.addControl(selectControl);
selectControl.activate();
// --- WEBSOCKET HANDLING (No changes here) ---
var ws, reconnectInterval=5000, reconnectTimer;
function connectWebSocket() { try { ws = new WebSocket(WEBSOCKET_URL); ws.onopen = function() { showNotification('Connected to live device tracking', 'success'); clearTimeout(reconnectTimer); }; ws.onmessage = function(event) { try { var deviceData = JSON.parse(event.data); updateDevice(deviceData); } catch (error) { console.error('Error parsing WebSocket message:', error); } }; ws.onclose = function() { showNotification('Lost connection to device tracking', 'warning'); scheduleReconnect(); }; ws.onerror = function() { showNotification('Device tracking connection error', 'error'); }; } catch (error) { scheduleReconnect(); } }
function scheduleReconnect() { clearTimeout(reconnectTimer); reconnectTimer = setTimeout(connectWebSocket, reconnectInterval); }
connectWebSocket();
// --- FULL-FEATURED CONTROL PANEL ---
function updateDeviceCounter() { var count = deviceMarkers.size; var counterElement = document.getElementById('device-counter'); if (counterElement) { counterElement.textContent = 'Live Devices: ' + count; } }
function showNotification(message, type) { var notification = document.createElement('div'); notification.className = 'alert alert-' + type + ' device-tracker-notification'; notification.innerHTML = '<button type="button" class="close" data-dismiss="alert">×</button>' + message; var container = document.querySelector('#lizmap-content') || document.body; container.insertBefore(notification, container.firstChild); setTimeout(function() { if (notification.parentNode) { notification.parentNode.removeChild(notification); } }, 5000); }
function addControlPanel() {
var controlPanel = document.createElement('div');
controlPanel.id = 'device-tracker-panel';
controlPanel.className = 'device-tracker-panel';
controlPanel.innerHTML = `
<div class="panel panel-default">
<div class="panel-heading">
<h4 class="panel-title">Live Device Tracking</h4>
<button id="minimize-panel-btn" class="btn btn-xs btn-default" title="Minimize">_</button>
</div>
<div id="device-panel-body" class="panel-body">
<div id="device-counter">Live Devices: 0</div>
<div class="btn-group" style="width:100%; margin-bottom: 5px;">
<button id="zoom-out-btn" class="btn btn-sm btn-default" style="width:50%">Zoom Out</button>
<button id="zoom-in-btn" class="btn btn-sm btn-default" style="width:50%">Zoom In</button>
</div>
<button id="center-devices-btn" class="btn btn-sm btn-info" style="width:100%; margin-bottom: 5px;">Center on Devices</button>
<button id="toggle-devices-btn" class="btn btn-sm btn-primary" style="width:100%;">Hide Layer</button>
</div>
</div>
`;
document.body.appendChild(controlPanel);
document.getElementById('minimize-panel-btn').addEventListener('click', function() {
var body = document.getElementById('device-panel-body');
if (body.style.display === 'none') { body.style.display = 'block'; this.innerHTML = '_'; this.title = 'Minimize'; }
else { body.style.display = 'none'; this.innerHTML = '□'; this.title = 'Maximize'; }
});
document.getElementById('zoom-in-btn').addEventListener('click', function() { lizMap.map.zoomIn(); });
document.getElementById('zoom-out-btn').addEventListener('click', function() { lizMap.map.zoomOut(); });
document.getElementById('toggle-devices-btn').addEventListener('click', function() {
deviceLayer.setVisibility(!deviceLayer.getVisibility());
this.textContent = deviceLayer.getVisibility() ? 'Hide Layer' : 'Show Layer';
});
document.getElementById('center-devices-btn').addEventListener('click', function() {
if (deviceMarkers.size > 0) {
var bounds = deviceLayer.getDataExtent();
if (bounds) { lizMap.map.zoomToExtent(bounds); }
}
});
}
addControlPanel();
// --- CSS STYLES ---
var styles = `
.device-tracker-panel { position: fixed; right: 10px; top: 70px; z-index: 2001; background: white; border-radius: 5px; box-shadow: 0 2px 10px rgba(0,0,0,0.3); width: 250px; }
.device-tracker-panel .panel-heading { display: flex; justify-content: space-between; align-items: center; padding: 8px 12px; }
.device-tracker-panel .panel-body { padding: 10px; }
.device-tracker-panel #minimize-panel-btn { padding: 1px 6px; }
#device-counter { font-weight: bold; margin-bottom: 10px; color: #2c3e50; text-align: center; }
`;
var styleSheet = document.createElement('style'); styleSheet.textContent = styles; document.head.appendChild(styleSheet);
window.addEventListener('beforeunload', function() { if (ws) ws.close(); });
}
})();
It’s a big script, most of it generated using Chatgpt, Claude.ai and Github Copilot.
Kind regards and thanks in advance,
NMS