More mem usage with v. 2.27.1

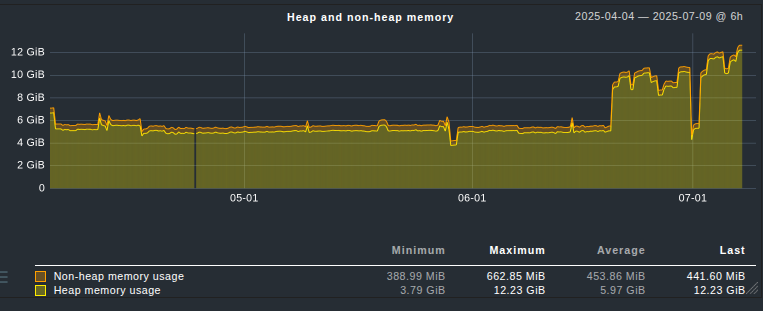
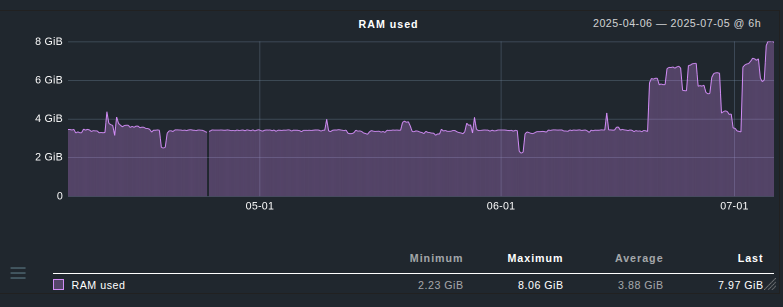
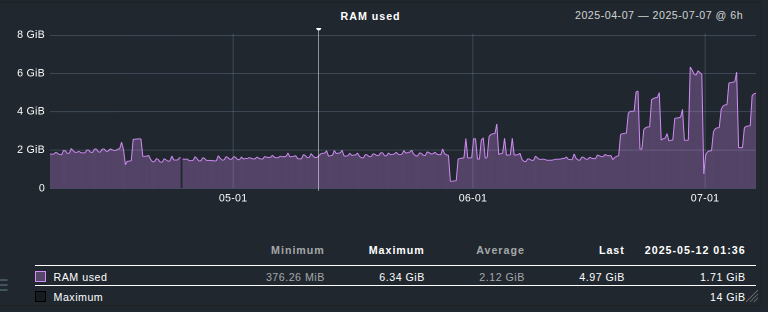
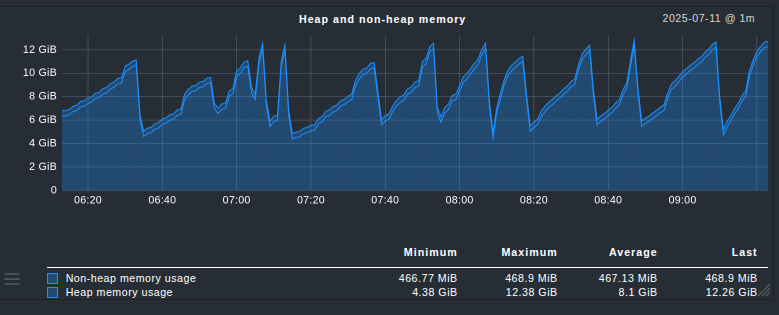
I have a GeoServer installation which has started using much more memory after upgrading from version 2.27.0 to 2.27.1. Are others seeing something similar?

Some graphs from monitoring are attached below. When viewing the graphs: Version 2.27.1 was put in use on 2025-06-18. On June 30th, we increased the value of -Xmx from 11844M to 14g because our heap usage% had increased so much.

JVM heap + nonheap:

JVM pool g1 eden:

JVM pool g1 old gen:

Java: Ubuntu’s OpenJDK 17.0.15. GeoServer is being run as a WAR in Tomcat 9.0.104.

I have some other GeoServer installations where a memory increase is not seen in version 2.27.1, but I suspect they aren’t as heavily used.

Hi,
haven’t noticed it, no, but the jump is small, so we might have a chance at pinpointing something in the GeoServer and GeoTools changelogs.
Can you describe what kind of data you publish, what workload GeoServer is subjected to?
Did you change anything else along with the 2.27.1 upgrade? E.g. Java version, Tomcat version, new data layers?

Cheers
Andrea

The Tomcat in use has two different GeoServer webapps (both running GeoServer 2.27.1). The workload os almost exclusively WFS, but also a little bit of WMS. Java and Tomcat versions were unchanged when GeoServer was upgraded from 2.27.0 to 2.27.1.

As far as I know, the workload characteristics didn’t change at the time of the GeoServer upgrade. There has most likely been new layers added, but those new layers should not differ significantly from existing layers.

Hi,
checking at the changelogs I don’t see anything that would explain the extra memory usage:

The only thing that seems remotely related is the XML external processing handling done to fix a CVE, but it’s related to XML parsing, not production.

When the memory usage is high, go to “server status”, JVM console, and use the “heap dump” button, you’ll get a text that’s an histogram of the objects using the heap, something like this:

 num     #instances         #bytes  class name (module)
-------------------------------------------------------
   1:        397070       30889672  [B (java.base@11.0.16)
   2:        252718       14152208  org.hsqldb.index.NodeAVLDisk
   3:        385772        9258528  java.lang.String (java.base@11.0.16)
   4:         95347        5668856  [Ljava.lang.Object; (java.base@11.0.16)
   5:        153231        4903392  java.util.concurrent.ConcurrentHashMap$Node (java.base@11.0.16)
   6:         26807        3922240  [I (java.base@11.0.16)
   7:        109794        3513408  java.util.HashMap$Node (java.base@11.0.16)
   8:          2265        3481264  [C (java.base@11.0.16)
   9:         27729        3360232  java.lang.Class (java.base@11.0.16)
  10:         32906        2467152  [Ljava.util.HashMap$Node; (java.base@11.0.16)
  11:         53626        2145040  java.util.LinkedHashMap$Entry (java.base@11.0.16)
  12:         36414        2039184  org.hsqldb.RowAVLDisk
...

Can you share the results here?

Cheers
Andrea

The heap dump at https://troels.arvin.dk/gis/geoserver/geoserver_memusage_2025/heap_dump1.log.txt was taken at the time corresponding to the right-most peak in the following 3-hour graph:

I see, the first elements look as follows:

 num     #instances         #bytes  class name (module)
-------------------------------------------------------
   1:      13997653      451599952  [B (java.base@17.0.15)
   2:      10708921      428356840  com.sun.org.apache.xerces.internal.dom.AttrNSImpl (java.xml@17.0.15)
   3:      10549647      337588704  com.sun.org.apache.xerces.internal.dom.TextImpl (java.xml@17.0.15)
   4:      13980873      335540952  java.lang.String (java.base@17.0.15)
   5:       2052388      262705664  org.eclipse.xsd.impl.XSDElementDeclarationImpl
   6:       6537834      261513360  org.eclipse.emf.ecore.util.EObjectContainmentEList
   7:       2856881      182840384  java.util.concurrent.ConcurrentHashMap (java.base@17.0.15)
   8:       2052592      180628096  org.eclipse.xsd.impl.XSDParticleImpl
   9:       4237217      169488680  org.eclipse.emf.ecore.util.EDataTypeUniqueEList
  10:       4225506      169020240  org.eclipse.emf.ecore.util.EDataTypeUniqueEList$Unsettable
...

The first entry is likely the raster processing tile cache, ~430MB worth of it… not odd per se, if the server was processing raster data too.
The others are instead odd, it’s a large chunk of XML objects… they should not be summed, e.g. AttrNsImpl and TextNsImpl both contain String.

I’ve made a quick load test against a server, doing WFS 1.1 request as POST, 8000 requests, 32 threads, and I’m not getting anywhere close your situation, in fact, I barely see XML related objects in the heap dump.

It seems something specific to your setup. What kind of WFS requests do you get, are you collecting samples? If not, you can by having GeoServer log the request and log also the request bodies. Are you using app-schema?
What are your data sources? Any chance they are other WFS servers (WFS cascading scenario)?

Cheers
Andrea

1 Like

Collecting good samples will take a while. For now I can say that data source is solely PostGIS, not other WFS servers.

And have you tried to reproduce this using the default data directory (yes, I know it uses SHP files, etc, not PostGIS), but if you’re able to provide the developers with an easily reproducible scenario, it will get a lot more attention.

Peter