On 08/07/13 15:36, Daniel Kastl wrote:
hi Daniel, Steve,
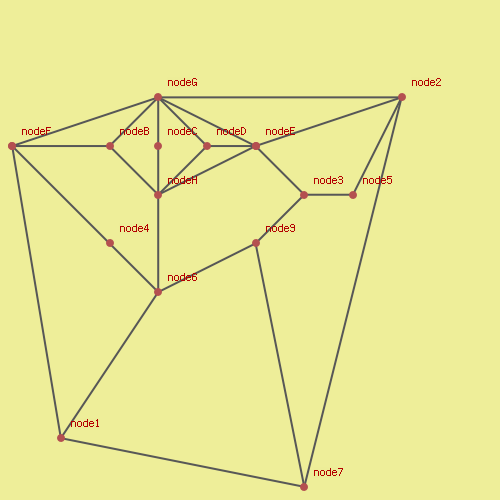
I had a bit of play and came up with this
map.png is the output of running
shp2img -m demo.map
The file demo.map is a mapserver file for creating the picture
mktabl.sql is an sql script for making the tables
and sql2tab.sql dumps the contents of route_table and vertexts tables as source,target,cost setting
One off the problems that I with the existing demo map is that most of the costs of getting from a to b is always 1, this is designed to be different.
I any body can think of any improvements, please let me known
Dave.
On Mon, Jul 8, 2013 at 10:27 PM, Dave Potts <dave.potts@pinan.co.uk <mailto:dave.potts@pinan.co.uk>> wrote:
On 08/07/13 14:27, Stephen Woodbridge wrote:
On 7/8/2013 5:59 AM, Dave Potts wrote:
hi Steve
What bit of software was used to visualise the existing network?
Is it based on a screen shot from something like mapserver?
I for one am very great full to the vast amount of effort that has
been put in to version 2.0.
Hi Steve,
With the sample data I was a bit lazy, I must admit.
Steve had this network image and a table, so I just used it.
I know that it doesn't work so well for TSP and Driving Distance. Some larger network would be better.
But then the SQL to copy and paste also becomes much larger.
Well, I'm glad if someone could provide a better but still simple sample network for the documentation.
It's not so easy to find something that covers all algorithms and is still simple.
Right now it's still the better option than no sample network 
Daniel
Dave.
hi List,
Is it possible to rewrite the sample data network to (
http://docs.pgrouting.org/dev/doc/src/developer/sampledata.html#sampledata
)to include a more distinctive data sample?
I have been trying to use it to provide an input data
sample for a TSP
problem. I had problems because the current network
generates several
routes that all look identical to the TSP so if you
attempt to do some
topological work, you end up with several identicial
routes selections.
For example the selection
SELECT seq, id FROM
pgr_tsp('{{0,1,3,3},{1,0,2,2},{3,2,0,2},{3,2,2,0}}',X);
where x is in the range 0-3 will generate 4 paths of
which the profile is two routes of 121 or 212 measured in
distance unit terms
Dave,
Daniel was trying to use one sample data for all the examples
and in general this as worked well for most of the examples
where we are computing simple routes. I think the driving
distance and tsp examples probably need to have a slightly
larger graph too adequately demonstrate the function.
If you have another graph that you think might be more
appropriate for demonstrating both of these commands commands
I think there is room for it. I know Daniel and I are both
tied up at the moment on funded project work at the moment,
but it you were inclined to make an additional sample graph
and update the docs we would love to get a pull request to
help out the release.
We have put a lot of effort into having complete documentation
coverage of all the functions in 2.0. We still have some work
to do but this is an area that we would be happy to get help
on. If you don't have time to do this at least open a ticket
so it gets tracked.
Best regards,
-Steve
_______________________________________________
pgrouting-dev mailing list
pgrouting-dev@lists.osgeo.org
<mailto:pgrouting-dev@lists.osgeo.org>
http://lists.osgeo.org/mailman/listinfo/pgrouting-dev
_______________________________________________
pgrouting-dev mailing list
pgrouting-dev@lists.osgeo.org <mailto:pgrouting-dev@lists.osgeo.org>
http://lists.osgeo.org/mailman/listinfo/pgrouting-dev
--
Georepublic UG & Georepublic Japan
eMail: daniel.kastl@georepublic.de <mailto:daniel.kastl@georepublic.de>
Web: http://georepublic.de/>
_______________________________________________
pgrouting-dev mailing list
pgrouting-dev@lists.osgeo.org
http://lists.osgeo.org/mailman/listinfo/pgrouting-dev
demo.map (1.51 KB)
mktab.sql (7.2 KB)
sql2tab.sql (246 Bytes)