So I see your data now,
as a table on a mail, and as first glance I “see” that something is wrong,
But I need to reproduce your problem, so I need the data in such a way that I can copy paste.
So imagine I have a problem and I need you help me finding what is my problem:
I have this data:
CREATE TABLE edge_table (
id BIGSERIAL,
dir character varying,
source BIGINT,
target BIGINT,
cost FLOAT,
reverse_cost FLOAT,
capacity BIGINT,
reverse_capacity BIGINT,
category_id INTEGER,
reverse_category_id INTEGER,
x1 FLOAT,
y1 FLOAT,
x2 FLOAT,
y2 FLOAT,
the_geom geometry
);
INSERT INTO edge_table (
category_id, reverse_category_id,
cost, reverse_cost,
capacity, reverse_capacity,
x1, y1,
x2, y2) VALUES
(3, 1, 1, 1, 80, 130, 2, 0, 2, 1),
(3, 2, -1, 1, -1, 100, 2, 1, 3, 1),
(2, 1, -1, 1, -1, 130, 3, 1, 4, 1),
(2, 4, 1, 1, 100, 50, 2, 1, 2, 2),
(1, 4, 1, -1, 130, -1, 3, 1, 3, 2),
(4, 2, 1, 1, 50, 100, 0, 2, 1, 2),
(4, 1, 1, 1, 50, 130, 1, 2, 2, 2),
(2, 1, 1, 1, 100, 130, 2, 2, 3, 2),
(1, 3, 1, 1, 130, 80, 3, 2, 4, 2),
(1, 4, 1, 1, 130, 50, 2, 2, 2, 3),
(1, 2, 1, -1, 130, -1, 3, 2, 3, 3),
(2, 3, 1, -1, 100, -1, 2, 3, 3, 3),
(2, 4, 1, -1, 100, -1, 3, 3, 4, 3),
(3, 1, 1, 1, 80, 130, 2, 3, 2, 4),
(3, 4, 1, 1, 80, 50, 4, 2, 4, 3),
(3, 3, 1, 1, 80, 80, 4, 1, 4, 2),
(1, 2, 1, 1, 130, 100, 0.5, 3.5, 1.999999999999,3.5),
(4, 1, 1, 1, 50, 130, 3.5, 2.3, 3.5,4);
UPDATE edge_table SET the_geom = st_makeline(st_point(x1,y1),st_point(x2,y2)),
dir = CASE WHEN (cost>0 AND reverse_cost>0) THEN 'B' -- both ways
WHEN (cost>0 AND reverse_cost<0) THEN 'FT' -- direction of the LINESSTRING
WHEN (cost<0 AND reverse_cost>0) THEN 'TF' -- reverse direction of the LINESTRING
ELSE '' END; -- unknown
SELECT pgr_createTopology('edge_table',0.001);
With that data I am getting:
SELECT * FROM pgr_dijkstra(‘select id, source, target, cost, reverse_cost FROM edge_table’, 1, 15);
seq | path_seq | node | edge | cost | agg_cost
···
On Sun, May 20, 2018 at 4:43 AM, andy <aborruso@gmail.com> wrote:
Hi Vicky,
On Sat, 19 May 2018 at 19:18, Vicky Vergara vicky@georepublic.de wrote:
Here the output (I have added the geom)
| id |
source |
target |
cost |
geom |
| 1 |
1 |
2 |
1875.887941 |
SRID=32632;LINESTRING(526471.864222973 5083313.32108108,527988.654493243 5082209.55351351) |
| 2 |
3 |
1 |
1551.56248159 |
SRID=32632;LINESTRING(525738.392871622 5081946.07351351,526471.864222973 5083313.32108108) |
| 3 |
1 |
4 |
1506.74402482 |
SRID=32632;LINESTRING(526471.864222973 5083313.32108108,527803.506385135 5084018.30810811) |
| 4 |
4 |
5 |
1208.08883443 |
SRID=32632;LINESTRING(527803.506385135 5084018.30810811,528985.605844594 5084267.54594595) |
| 5 |
2 |
6 |
1447.12212188 |
SRID=32632;LINESTRING(527988.654493243 5082209.55351351,527020.187466217 5081134.27027027) |
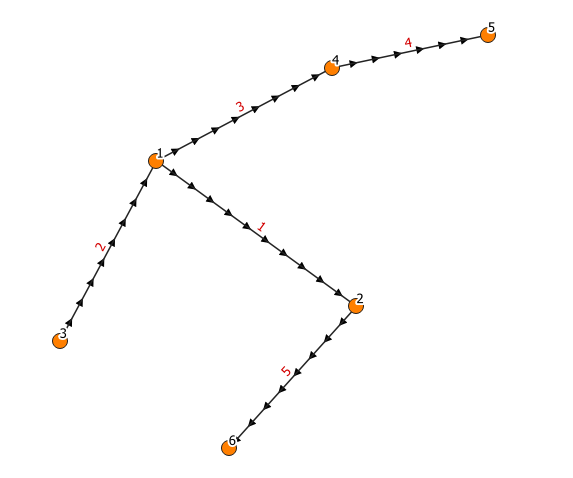
And this is an image generated from this data (my starting point is 1).
![immagine.png]()
Thank you very much
–
Andrea Borruso
website: https://medium.com/tantotanto
38° 7’ 48" N, 13° 21’ 9" E, EPSG:4326
“cercare e saper riconoscere chi e cosa,
in mezzo all’inferno, non è inferno,
e farlo durare, e dargli spazio”
Italo Calvino
Pgrouting-users mailing list
Pgrouting-users@lists.osgeo.org
https://lists.osgeo.org/mailman/listinfo/pgrouting-users
–
I don’t see your data, can you put the contents of the data
The only similar thing as “data” I have is your interpretation of a table contents.
This is the data:
SELECT ogc_fid as id, source, target, st_length(wkb_geometry)
as "cost" FROM linee;
Georepublic UG (haftungsbeschränkt)
Salzmannstraße 44,
81739 München, Germany

Vicky Vergara
Operations Research

eMail: vicky@[georepublic.de](http://georepublic.de)
Web: [https://georepublic.info](https://georepublic.info)

Tel: +49 (089) 4161 7698-1
Fax: +49 (089) 4161 7698-9

Commercial register: Amtsgericht München, HRB 181428
CEO: Daniel Kastl


