Hello, GeoServer Community,
I would like to propose a new module for the Monitoring extension to enhance the observability of GeoServer.
The goal of this module is to improve monitoring by providing a specialized visualization of requests made to a GeoServer instance. Specifically, it will integrate with a Micrometer registry to expose a Prometheus-compatible metrics endpoint. This will allow Prometheus instances to scrape and collect usage metrics for GeoServer, enabling better insight into request patterns and system performance.
Background
Micrometer is a metrics instrumentation library that provides a simple and consistent API for collecting application metrics. It acts as a facade over different monitoring systems, allowing developers to expose metrics in a standardized way. One of its key integrations is with Prometheus, a widely used open-source monitoring system designed for time-series data collection. Prometheus scrapes metrics from HTTP endpoints at regular intervals, storing them for analysis, alerting, and visualization through tools like Grafana.
By integrating Micrometer with GeoServer’s Monitor extension, we can expose request-related metrics in a Prometheus-compatible format. This will enable system administrators and developers to gain deeper insights into GeoServer’s performance, track API usage patterns, and set up alerts based on predefined thresholds. The combination of Micrometer and Prometheus will thus provide a powerful observability framework for GeoServer, facilitating proactive monitoring and performance optimization.
Proposal Overview
The Monitoring extension currently provides several ways to interact with request data: in-memory storage, database persistence, and file logging. Additionally, there is a community module that allows sending request audit logs to a Kafka topic.
My proposal is to introduce a new way to visualize tracked requests by implementing an additional request data listener. This listener will use Micrometer to categorize incoming requests and track various metrics, such as the number of requests, response sizes, and execution durations.
A new monitoring HTTP endpoint will then expose these metrics in a Prometheus-compatible text-based format, making them ready to be scraped and processed by Prometheus.
The Monitor Micrometer extension will allow fine-grained control over how request data is incorporated into Micrometer’s registry.
Each metric measures a specific aspect of a request, such as timers, which track request durations (e.g., how long a WFS request takes to complete) or counters, which measure occurrences (e.g., the number of requests made for a specific WMS layer).
The extension will manage the following metrics for each request:
- Total time
- Response length
- Resources processing times
- Labels processing time
- Remote address of the calling host (optional)
To avoid tracking individual requests separately, requests will be grouped by attribute values, for example, by remote address or OGC protocol. Each attribute will be assigned a name, which will serve as a Micrometer Tag. Requests sharing the same tag values will be aggregated into a single metric group, ensuring efficient and meaningful data collection.
However, one challenge with this approach is that the number of metric groups can grow significantly, depending on how requests are categorized. Since metrics are grouped by their attribute values (such as remote address or OGC protocol), the number of unique groups could become very large in high-traffic environments, potentially impacting performance and memory usage.
To mitigate this, the extension will include specific configuration options that allow users to control metric cardinality:
- Disabling remote host-based metrics: a configuration flag will allow users to exclude the HTTP “remote” information attributes from the metric tags, reducing the number of unique metric groups.
- Limiting tracked requests: a configurable maximum number of requests will be enforced. Once this limit is reached, the registry will reset, clearing the existing metrics and starting fresh. This ensures that the system does not accumulate an unbounded number of metrics over time.
These mechanisms should provide enough flexibility to administrators to balance observability needs with resource constraints.
Like other settings in the GeoServer Monitoring extension, the Monitor Micrometer module will be enabled via the extension’s configuration file, where users can fine-tune its parameters.
Follows a small end-to-end example about how the Monitor Micrometer extension could be used in a real-world scenario.
A bunch of requests have been made to GeoServer, as shown by the Monitor extension HTML visualization:

These requests have been recorded by the Monitor Micrometer extension in its own Micrometer registry; the latter can be queried by the available HTTP endpoint to get the metrics in Prometheus format.
Follows an excerpt of the response:
[...]
# HELP requests_processing_seconds
# TYPE requests_processing_seconds summary
requests_processing_seconds_count{errorMessage="",httpMethod="GET",operation="GetMap",owsVersion="1.1.1",resources="sf:roads",responseContentType="image/jpeg",responseStatus="200",service="WMS",status="FINISHED"} 3
requests_processing_seconds_sum{errorMessage="",httpMethod="GET",operation="GetMap",owsVersion="1.1.1",resources="sf:roads",responseContentType="image/jpeg",responseStatus="200",service="WMS",status="FINISHED"} 0.632
requests_processing_seconds_count{errorMessage="",httpMethod="GET",operation="GetMap",owsVersion="1.1.1",resources="sf:roads",responseContentType="image/jpeg",responseStatus="200",service="WMS",status="INTERRUPTED"} 1
requests_processing_seconds_sum{errorMessage="",httpMethod="GET",operation="GetMap",owsVersion="1.1.1",resources="sf:roads",responseContentType="image/jpeg",responseStatus="200",service="WMS",status="INTERRUPTED"} 0.555
requests_processing_seconds_count{errorMessage="No service: ( WMTS )",httpMethod="GET",operation="None",owsVersion="",resources="",responseContentType="application/xml",responseStatus="200",service="None",status="CANCELLING"} 1
requests_processing_seconds_sum{errorMessage="No service: ( WMTS )",httpMethod="GET",operation="None",owsVersion="",resources="",responseContentType="application/xml",responseStatus="200",service="None",status="CANCELLING"} 0.555
# HELP requests_processing_seconds_max
# TYPE requests_processing_seconds_max gauge
requests_processing_seconds_max{errorMessage="",httpMethod="GET",operation="GetMap",owsVersion="1.1.1",resources="sf:roads",responseContentType="image/jpeg",responseStatus="200",service="WMS",status="FINISHED"} 0.066
requests_processing_seconds_max{errorMessage="",httpMethod="GET",operation="GetMap",owsVersion="1.1.1",resources="sf:roads",responseContentType="image/jpeg",responseStatus="200",service="WMS",status="INTERRUPTED"} 0.555
[...]
Prometheus has then been instructed to scrape that page regularly, so it can digest the metrics and produce results like the following:
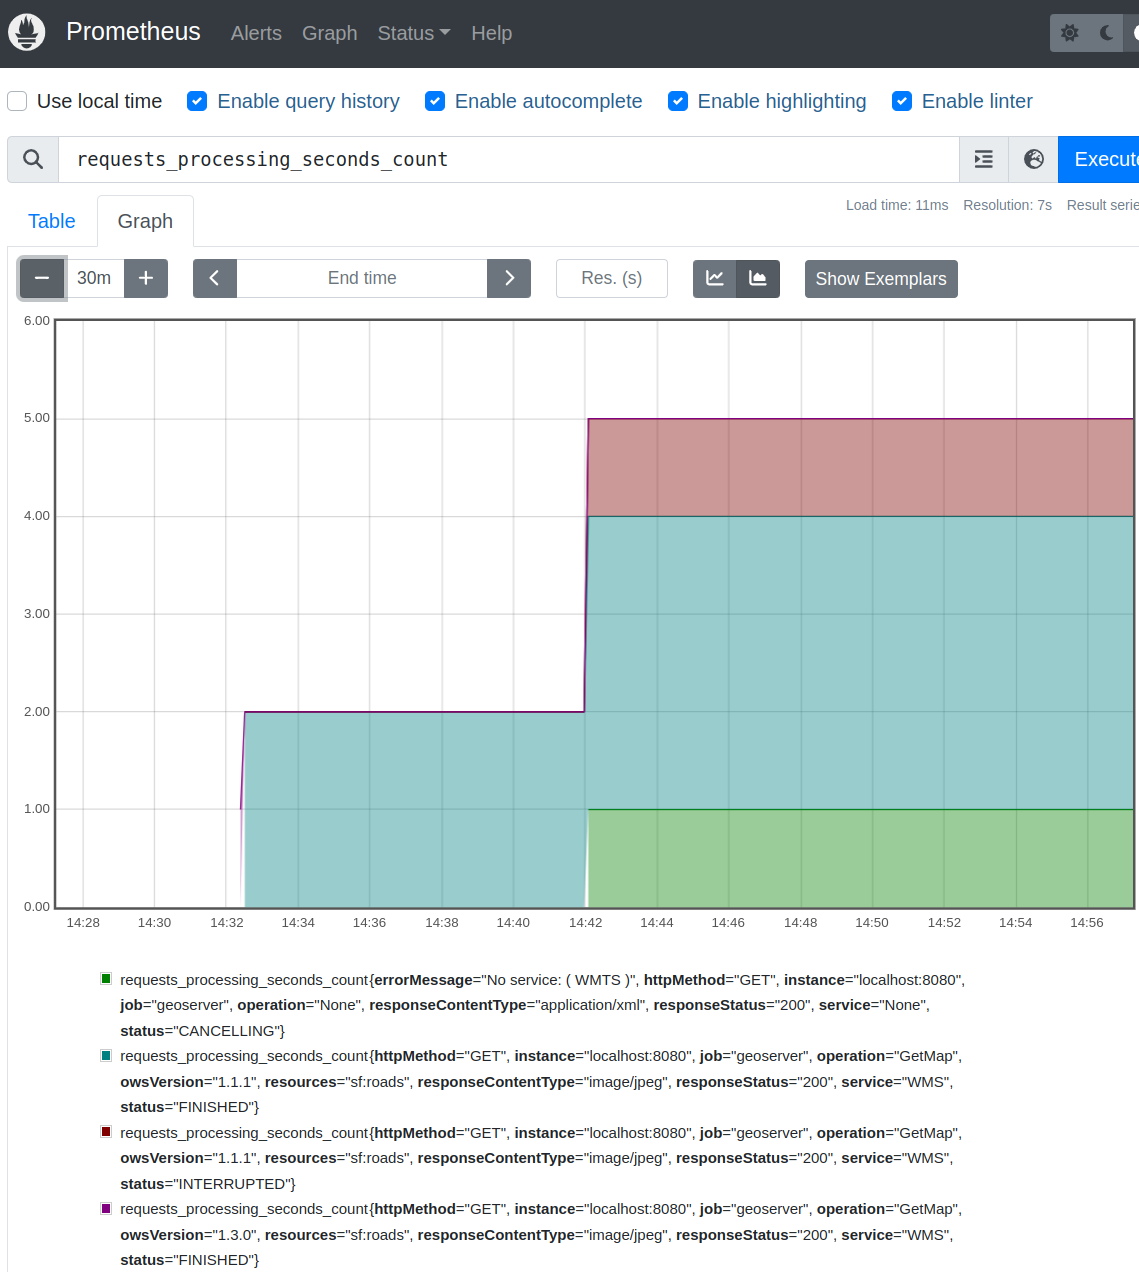
This graph shows how much time the requests processing took in total, and it is just an example of the possible visualizations that can be created based on the collected metrics.
Moreover, if the use case needs are more complex, Prometheus can be used as a data store for Grafana to have even more visualization possibilities through interactive dashboards, plus a valid alerting platform to generate various forms of alerts based on the collected data.
Shown below is a simple example of the Grafana visualization based on Prometheus metrics.

Impact and Benefits
The introduction of the Monitor Micrometer extension will significantly enhance GeoServer’s observability by integrating seamlessly with modern monitoring and alerting ecosystems. By exposing structured metrics in a Prometheus-compatible format, this extension enables real-time insights into GeoServer’s performance, resource consumption, and request patterns.
Administrators and DevOps teams will benefit from:
- Improved Performance Monitoring: the ability to track request processing times, response sizes, and error rates allows for precise performance tuning and bottleneck identification.
- Scalability Insights: with metrics grouped by key attributes, users can analyze traffic distribution and optimize deployments accordingly.
- Seamless Integration: Prometheus’ flexible querying and alerting capabilities, combined with Grafana’s advanced visualizations, enable intuitive dashboards and automated notifications.
- Better Troubleshooting and Alerting: real-time data collection allows for rapid issue detection, helping teams proactively respond to anomalies before they impact users.
- Configurable Metric Granularity: the extension provides fine-grained control over which metrics are collected, ensuring that observability does not come at the cost of excessive resource usage.
Overall, this new extension will provide additional monitoring capabilities, making it easier to observe and analyze GeoServer’s usage and performance, particularly in production environments.
Implementation Plan
The implementation of this extension requires creating a new class that implements the org.geoserver.monitor.RequestDataListener interface. The requestPostProcessed callback will be then used to process request data and populate the Micrometer registry with relevant metrics.
Additionally, a dedicated controller will be introduced to expose the Prometheus-compatible metrics through an HTTP endpoint within the /monitor/requests path, under a specific sub-path.
This said, I am eager to hear your thoughts and feedback on this proposal.
Please feel free to share any concerns, suggestions, or alternative approaches that you believe should be considered.
Best regards,
Alessandro Ricchiuti