Ciao, ti quello che fa la differenza è il prompt: da quello che ho capito esegue codici python ad hoc quando non trova strumenti adeguati.
Questa è la conversazione di una vettorializzazione (come vedi ha prima valutato i tools nativi per poi passare a python):
riesci a vettorializzare l’immagine utilizzando come riferimento i diversi colori dell’immagine escludendo il bianco o simile?
I need to vectorize this image by classifying colors and excluding white tones—this is a raster-to-vector conversion task in QGIS. I should look for the execute_processing and execute_code tools since only a few are currently available.
Found tools
I’m planning to use PyQGIS with GDAL and NumPy to extract the raster data, classify pixels by color while filtering out white and near-white background pixels, then polygonize the result into vector features.
Writing code to inspect the raster…
Execute code
The raster is an ungeoreferenced PNG image with RGBA bands, so I can vectorize it in pixel space without worrying about coordinate systems. I need to sample the colors to understand what I’m working with—checking dominant colors, unique color counts, and identifying the pixel range for white or similar values. Then I’ll load the image and start analyzing it.
Execute code
The image is a photo with extensive color variation—38,327 unique colors from anti-aliasing and noise—showing tree canopies against a predominantly white background, which aligns with the project name referencing “chiome” (tree crowns in Italian). Given this complexity, a direct color-to-SVG conversion would be impractical, so I need to think about how to handle the massive color palette effectively.
The user wants to vectorize using different colors as reference points while excluding the white background, which suggests clustering the non-white pixels into a manageable number of color classes, then converting each class into polygons. I’ll mask out white and near-white pixels first (using a threshold where all RGB channels exceed ~235 and have minimal variation), then apply k-means clustering on the remaining pixels to group them into 6-8 representative color classes. After creating a classified raster with integer IDs for each cluster, I can use GDAL’s polygonize function to convert it into vector polygons, which I’ll save as a shapefile or GeoPackage for import into QGIS.
Looking at the actual color distribution, the white background pixels are essentially pure white (255,255,255) with minor JPEG artifacts, while the foreground greens have much lower blue channels (20-83 range), so a simple brightness threshold around 200 should cleanly separate them. I need to examine the histogram more carefully and check what’s happening in the intermediate range (118-200) to finalize the threshold.
Execute code
The white background is consistently around 64% of pixels across different thresholds, so I can safely filter it out by excluding pixels where the minimum channel value exceeds 200. That leaves about 36% of foreground pixels to cluster by color. I’ll use KMeans from sklearn to group these into a reasonable number of color classes, or fall back to manual quantization if the library isn’t available.
Execute code
I’ll skip the sklearn dependency and implement k-means clustering from scratch using numpy instead, which should be efficient enough for the 377k pixels. Since the image appears to be mostly olive-green shades varying in brightness—from dark tones around (53,69,20) to lighter ones near (204,209,92)—this likely represents different canopy density or shadow levels. I’m setting up a manual k-means algorithm with around 6 clusters to group the foreground pixels by their RGB values.
Once I have the cluster assignments, I’ll create a classified raster where the background stays as 0 (nodata) and foreground pixels get labeled 1 through k based on their cluster. Then I’ll write this as a GeoTIFF and use GDAL’s Polygonize function to convert each cluster class into vector polygons. Finally, I’ll load the resulting GeoPackage into QGIS with a categorized renderer styled by the representative centroid colors of each cluster, giving the user a clean legend and visualization.
Writing the complete script…
Execute code
The K-means clustering produced six classes that capture the gradient from dark to light olive green, likely reflecting variations in tree crown density and shadows. Now I’m converting this raster classification into vector polygons using GDAL’s polygonize function, then I’ll bring it into QGIS and apply categorized symbology based on the centroid colors of each class.
Execute code
I’m noticing the vectorization produced over 10,000 polygons, which is likely too noisy from per-pixel classification creating lots of small fragmented islands. I should apply a sieve filter to remove these tiny polygons and clean up the output.
Da: Totò Fiandaca noreply@discourse.osgeo.org
Inviato: Mercoledì, 22 Luglio, 2026 18:07
A: ludovicofrate@hotmail.it ludovicofrate@hotmail.it
Oggetto: [QGIS/QGIS-it-user] Vettorializzazione piano di volo
Someone replied to a topic you are Watching.
Ciao Ludovico,
mi hai incuriosito
 ludovico.frate:
Sono riuscito a vettorializzare delle cose inimmaginabile
vorrei capire un po’ meglio.
Il server mcp di qgis commette Claude con QGIS, ma QGIS ha sempre gli stessi strumenti, quindi quello che fa la differenza è ciò che chiedi (ovvero il prompt).
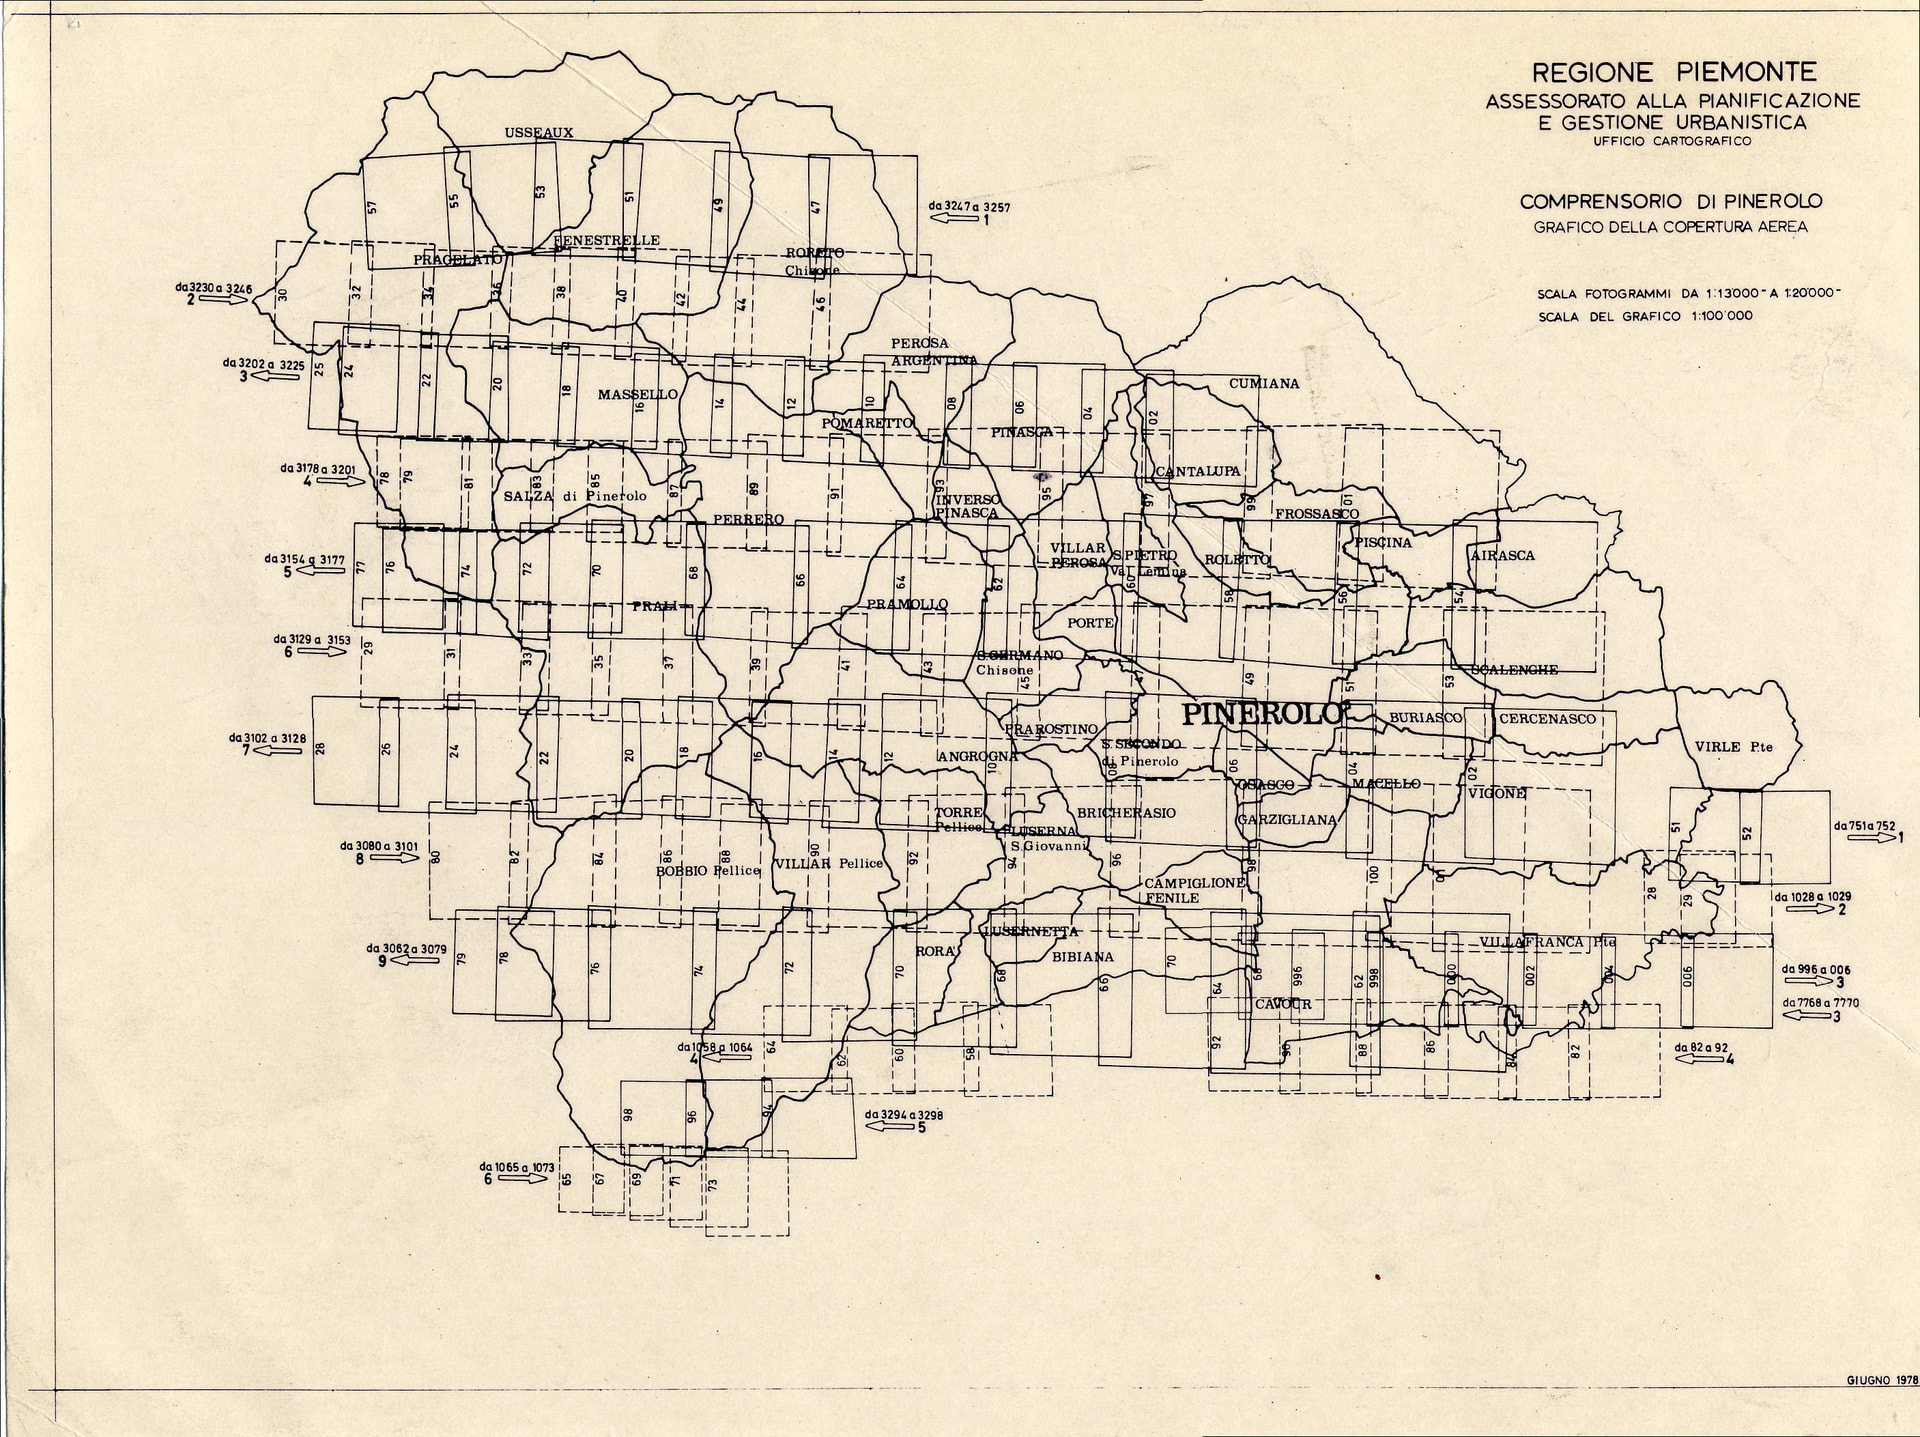
Che cosa gli chiederesti di fare nel caso dell’immagine di Stefano?
saluti